Fig. 7.
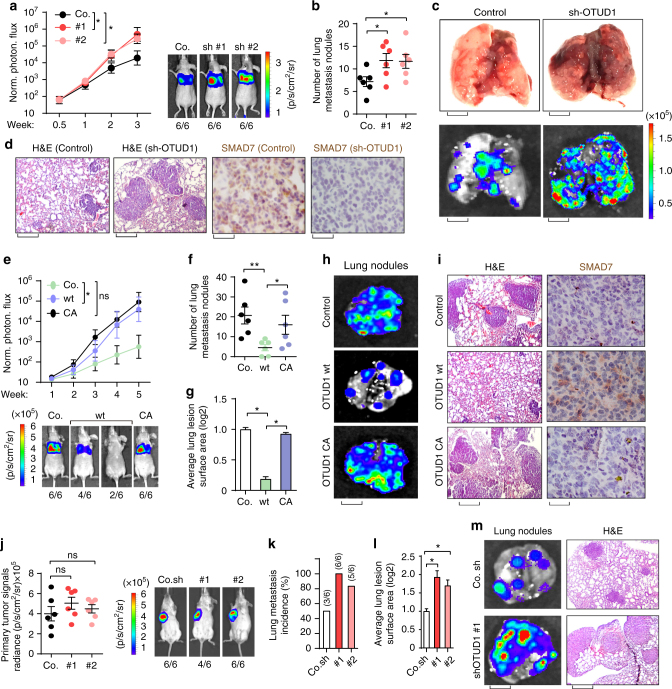
OTUD1 inhibits lung metastasis in transplantable mouse models of breast cancer metastasis. a–d Control (Co.) or OTUD1-silenced (sh#1 and sh#2) 4T07 cells were tail vein-injected into nude mice. Lung metastasis was measured by BLI. Normalized photon flux at the indicated times left (±SD) and representative images (right) are shown; p-values; Student’s t-test (a). Lung metastasis nodules in each group were calculated (±SD) and the representative images of bright view (c, upper panel; scale bar, 2 mm) and bioluminescent view (c, lower panel; scale bar, 2 mm) are shown. Representative HE and IHC staining pictures of lung sections of control and one shRNA-depleted OTUD1 group (d), scale bars, 1 mm and 20 μm for lung haematoxylin and eosin (H&E) and SMAD7 immunohistochemistry images, respectively). e–i Control (Co.) 4T1 cells or cells stably expressing OTUD1-wt or CA were tail vein-injected into nude mice. Lung metastasis was measured by BLI. Normalized photon flux (±SD) at the indicated times are shown in the upper panel and representative images in the lower; p values; Student’s t-test e. Lung metastasis nodules (±SD) f and average lung lesion surface area (±SD) g (arbitrary units based on pixel quantification from digital images) in each group were calculated and the representative images of bioluminescent view (h, scale bar, 2 mm) are shown. Representative HE and IHC staining pictures of lung sections of every experimental group (i, Scale bars, 1 mm and 20 μm for lung haematoxylin and eosin (H&E) and SMAD7 immunohistochemistry images, respectively) are shown. j–m Control (Co.) or OTUD1-depleted 4T1 cells were orthotropic injected in syngeneic BALB/c mice. Primary tumor formation in mice after orthotropic injection of each group at day 21 after implantation. Normalized BLI signals (±SD) (Left) and representative BLI signals of primary tumor. Number of lung metastasis nodules (k) and average lung lesion surface area (±SD) (l) (arbitrary units based on pixel quantification from digital images). Representative bioluminescent view of isolated lung (m, left, scale bar, 2 mm) and HE staining of lung section of each group (m, right, scale bar, 20 μm). *p < 0.05 and **p < 0.01 (two-tailed Student′s t-test a–l)

