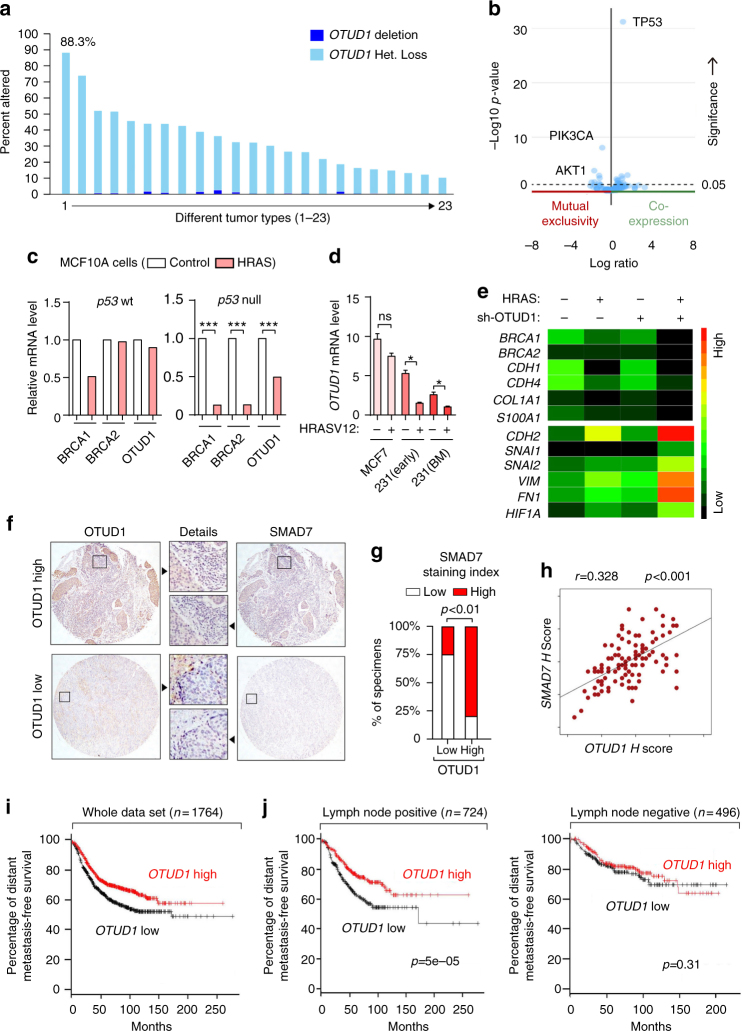
Fig. 8.
OTUD1 correlates with SMAD7 in human specimens and the loss of OTUD1 gene copies in human cancer correlates with poor prognosis. a Graph showing OTUD1 gene copy loss or deletion in different tumor types. Data were obtained from the TCGA database65, 66. Detailed values are listed in Supplementary Table 2. b Volcano plot showing that the rare breast cancer patients with gain or amplification of OTUD1 have co-occurrence with p53 expression and mutual exclusivity with expression of PIK3CA and AKT1. Data were obtained from the TCGA database65, 66. c Analysis of BRCA1, BRCA2, and OTUD1 mRNA level in p53 wt- and p53 null- MCF10A cells expressed with or without wild-type HRAS (GSE81593 dataset). d qPCR analysis of OTUD1 mRNA level in MCF7, MDA-MB-231 (early passage), MDA-MB-231 bone-metastatic (BM) cells that ectopically express HRASV12 or control vector. Values and error bars represent the mean ± SD of triplicates and are representative of at least two independent experiments. e Heat map of mRNA level of listed genes in MCF10A cells that stably express control or HRAS with depletion of OTUD1 (sh-OTUD1), as indicated. f–h Immunohistochemistry analysis of OTUD1 and SMAD7 in breast cancer tissue microarrays; representative pictures of each antibody staining are shown (f). Percentage of specimens displaying low or high SMAD7 expression compared to the expression levels of OTUD1 (g). Scatterplot showing the positive correlation between OTUD1 and SMAD7 expression in patients; Pearson’s coefficient tests were performed to assess statistical significance h. i Kaplan–Meier curves showing that the metastasis-free survival of individuals was positively correlated with OTUD1 expression. j Kaplan–Meier curves showing that the metastasis-free survival of individuals was positively correlated with OTUD1 expression in lymph node positive patient (Left) and has no correlation with OTUD1 in lymph node negative patients (Right). *p < 0.05 and ***p < 0.001 (two-tailed Student′s t-test (d, g), Pearson’s coefficient tests (h) or Log-rank test (i, j))

