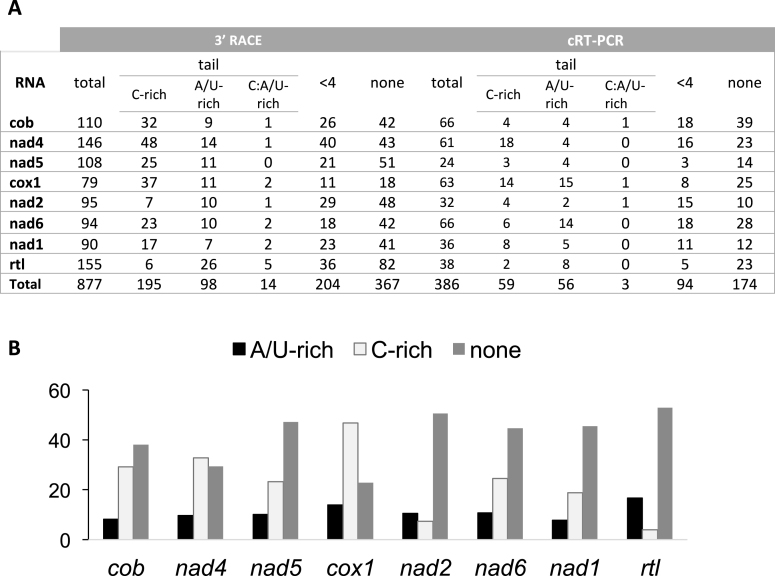
Figure 3.
Summary of the 3′-UTR analysis of mRNAs. (A) For each method, the total number of sequences analyzed are indicated. Sequences were classified in three groups (see ‘Materials and Methods’ section): sequences without any added nt (none), sequences with 1–3 nt (<4) and sequences with a tail i.e. with more than 3 nt (tail). The tails were classified into three categories according to their nt content [(nt observed/nt tail length)*100]: tails with >50% of Cytidine (C-rich), tails with >50% of Adenosine/Uridine (A/U-rich) and tails with equal amounts of Cytidine and Adenosine/Uridine (C:A/U-rich). (B) Histogram summarizing the data obtained in (A) by the 3′ RACE approach and showing the percentage of transcripts with A/U-rich tail (black), C-rich tail (pale gray) and no tail (dark gray) for each mt gene.

