Figure 8.
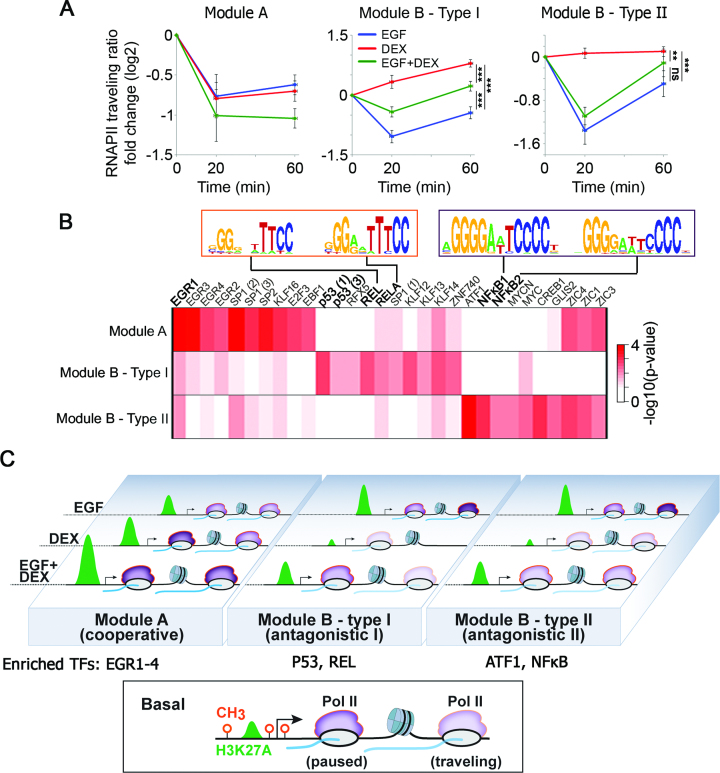
Kinetics of RNAPII recruitment and pause release in response to EGF and DEX exposes concealed subgroups of inducible genes and explains the transcriptional mechanism of the GF-to-GC crosstalk. (A) Average fold change of traveling ratios of RNAPII along different groups of genes before and after EGF, DEX and a combined stimulation. Shown are module A genes (nine genes) and module B genes, which were clustered into type I (nine genes whose traveling ratios decreased in response to EGF and increased in response to DEX) and type II (11 genes whose traveling ratios decreased after EGF treatment in at least one time point). **P < 0.01, ***P < 0.001 (two-way Anova). Non-significant differences to control are indicated (by ns). Bars represent standard errors of genes’ average. (B) A heatmap showing statistical enrichment of JASPAR motifs (67) among the different gene groups as defined in panel A. Pscan (http://159.149.160.51/pscan/; Jaspar 2016 database) was used to find over-represented TF binding sites. Only the top 10 enriched motifs from each group are shown (total of 30 motifs). Shown are the distinct NF-κB motifs enriched in the different gene groups. The respective P-values are minus log-transformed for easy presentation. (C) The scheme outlines the epigenetic processes governing the steroid-to-EGF crosstalk in mammary cells. The bottom box shows a typical inducible gene, which is poised for activation: the three methylation sites are unoccupied and moderate H3 acetylation occurs close to the TSS. The involved three gene modules (A, B-type I and B-type II), along with RNAPII molecules (in purple), are shown and their response to EGF, DEX or the combination (EGF + DEX) is outlined. Newly transcribed mRNA is shown in blue.

