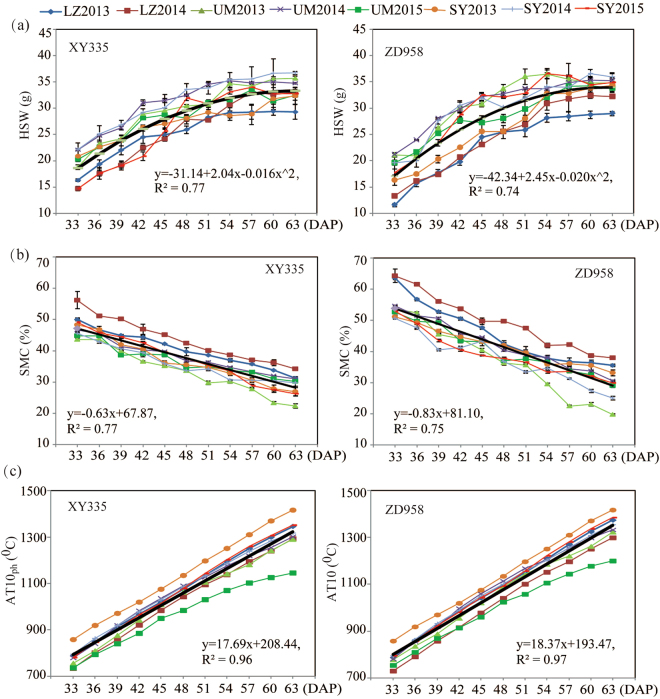
Figure 3.
Performance of (a) hundred-seed weight (HSW), (b) seed moisture content (SMC) and (c) ≥10 °C accumulated temperature from pollination to harvest (AT10ph) in response to harvest stage in XY335 and ZD958 grown in 3 locations (LZ, UM and SY) over 2–3 years (2013, 2014 and 2015). The relationship between harvest stage and the investigated traits was simulated using the “quadratic”, “linear” and “linear-plateau” models in the SAS program. The results from the best-fit model are presented by black lines and equations.

