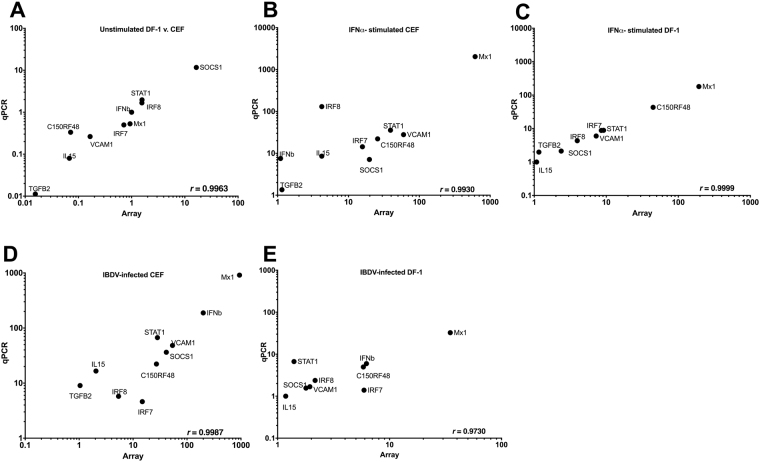
Figure 2.
Comparison of median differential expression levels for 10 selected transcripts determined by microarray and qRT-PCR analysis. Plots show log10 expression fold change for the selected genes under five different conditions: (A) Mock-treated DF-1 versus CEFs, (B) chIFN-α-stimulated versus mock-treated CEFs, (C) chIFN-α-stimulated versus mock-treated DF-1, (D) IBDV-infected versus mock-treated CEFs and (E) IBDV-infected versus mock-treated DF-1. Pearson correlation coefficients (r) are shown in the lower right corner of each plot.

