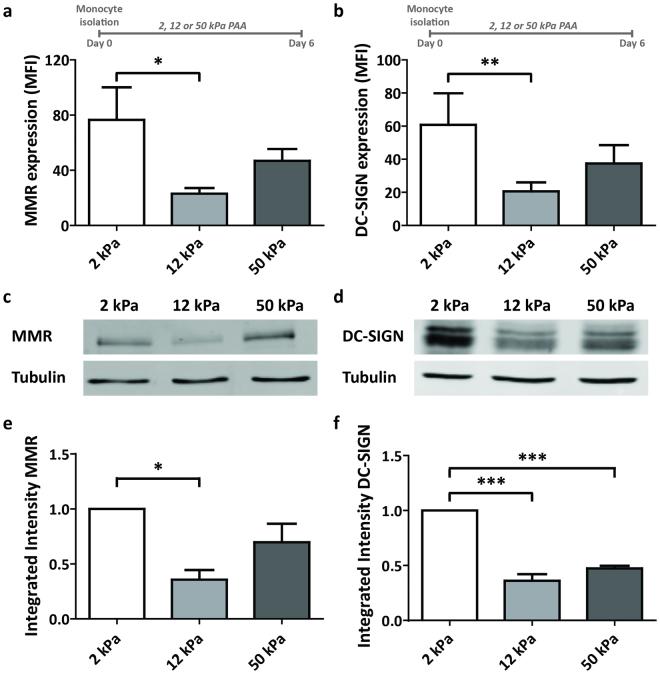
Figure 2.
Substrate stiffness regulates C-type lectin expression on iDCs. (a,b) Cell surface expression of C-type lectins MMR (a, n = 7 donors) and DC-SIGN (b, n = 7 donors) on iDCs conditioned for 6 days on PAA substrates of 2, 12 and 50 kPa, represented as geometric mean fluorescence intensity measured with flow cytometry. Bars represent mean with SEM. Statistical significance was tested with repeated measures ANOVA. (c,d) Representative images of western blot analysis of total MMR protein expression (c) and total DC-SIGN protein expression (d) in iDCs conditioned for 6 days on PAA substrates of 2, 12 or 50 kPa. Unprocessed original scans of blots are shown in Supplementary Fig. S9. (e,f) Quantification of integrated intensity of total MMR protein expression (e, n = 3 donors) and total DC-SIGN protein expression (f, n = 3 donors) measured by Western Blot analysis in iDCs conditioned for 6 days on PAA substrates of 2, 12 or 50 kPa. Per donor, integrated intensities are normalized to 2 kPa results. Bars represent mean with SEM. Statistical significance was tested with repeated measures ANOVA. *p < 0.05; ***p < 0.001.

