Figure 5.
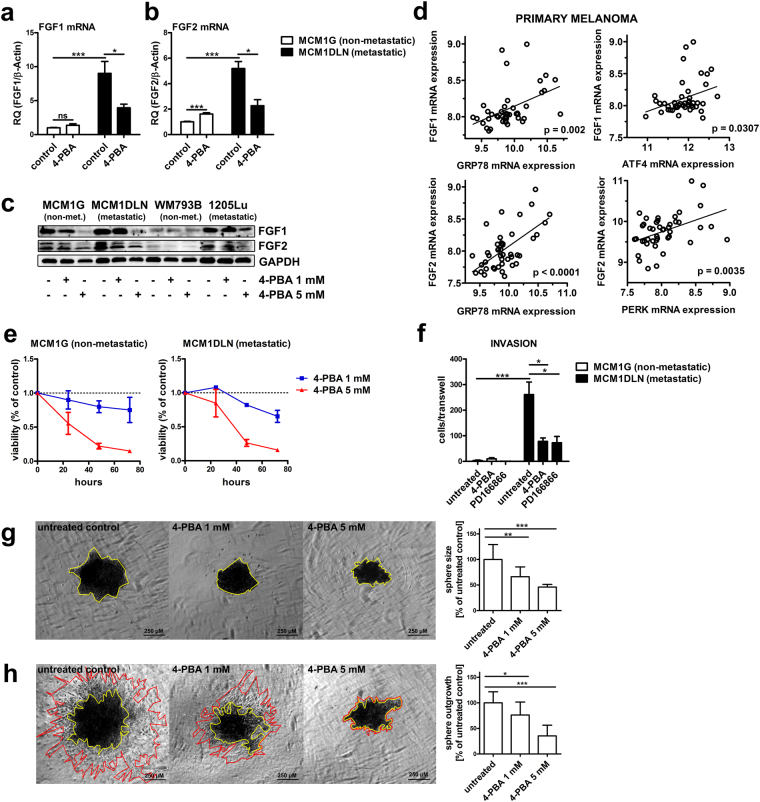
FGF1 and FGF2 expression and invasion is diminished by 4-PBA in metastatic melanoma cells. (a–b) Expression of FGF1 and FGF2 after UPR-reduction using 1 mM 4-PBA for 48 hours was determined by RT-qPCR (data shown in mean ± sem). (c) Protein expression of FGF1 and FGF2 after ER stress reduction using 4-PBA for 48 hours was determined in isogenic non-metastatic MCM1G and metastatic MCM1DLN cells and in isogenic non-metastatic WM793B and metastatic 1205Lu cells by immunoblotting. One representative blot out of three independent experiments is shown. Uncropped immunoblot scans are shown in supplementary Fig. S10. (d) Correlation of the mRNA expression of down-stream targets of the UPR with FGF1 and FGF2 was determined using microarray datasets from a previously published study16. (e) Viability assay of 1 mM and 5 mM 4-PBA treated MCM1G and MCM1DLN cells in MIM for the indicated time points (n = 3; data shown in mean ± sem). (f) Invasion assay of isogenic MCM1G and MCM1DLN cells pre-treated with 1 mM 4-PBA and 10 µM PD166866 for 16 hours in MIM, followed by 8 hours invasion through matrigel-coated transwells in MIM without FBS and 0.1% BSA containing the described treatments (n = 3; data shown in mean ± sem). (g) MCM1DLN sphere size areas with or without treatment with 4-PBA were evaluated after 72 hours in MIM containing 20% methylcellulose (n = 3; data shown in mean ± SD). For each treatment condition one representative image is shown. Yellow: spheroid. (h) Sphere outgrowth distance was determined after 24 hours in collagen gels treated with or without 4-PBA in MIM. Spheroids were pre-treated with 4-PBA during sphere formation for 72 hours MIM containing 20% methylcellulose (n = 3; data shown in mean ± SD). For each treatment condition one representative image of sphere outgrowths into collagen after 24 hours is shown. Yellow: spheroid; red: border of spheroid outgrowths.

