Figure 2.
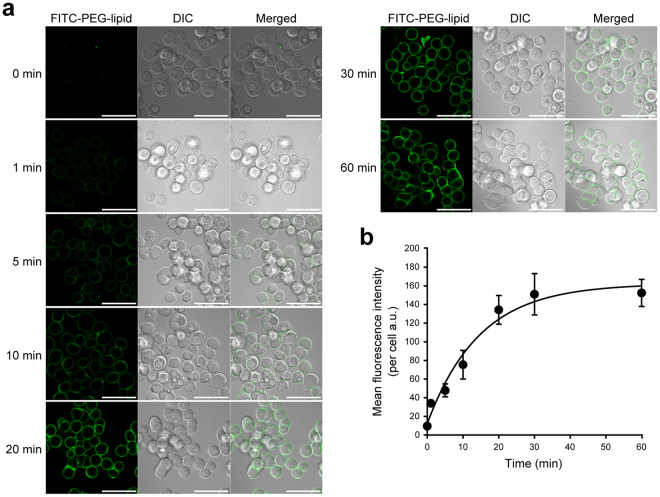
Time course of the cell surface labeling with FITC-PEG-lipid. Human gastric signet-ring-cell carcinoma KATO III cells were incubated with FITC-PEG-lipid for the indicated periods (0–60 min) at room temperature and subjected to confocal laser scanning microscopy with excitation at 488 nm and detection at 500–550 nm. (a) Representative images of confocal laser scanning microscopy of KATOIII cells labeled with FITC-PEG-lipid. At each time point, the fluorescent images of FITC-PEG-lipid (green, left panels), DIC images (gray scale, middle panels) and their merged images (right panels) are shown. Scale bars: 50 μm. (b) Plot of the mean fluorescence intensity of FITC-PEG-lipid per cell against the incubation time. The curve was obtained by fitting to a three-parameter single exponential model in non-linear regression analysis. Equation (1): Mean fluorescence intencity per cell = y0 + a × (1 − exp(−b × Time), where y0 = 12.5323, a = 149.7483, b = 0.6684. Error bars represent SD (n = 3–5).

