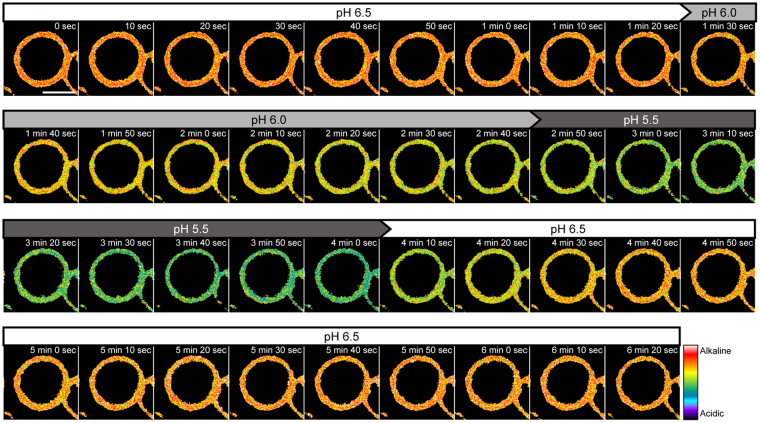
Figure 5.
Time-lapse imaging analysis of the cell surface pH using FITC-PEG-lipid. KATOIII cells labeled with FITC-PEG-lipids were subjected to a time-lapse imaging analysis. Images were acquired at the excitation wavelengths of 458 nm and 488 nm, with the fluorescence detection range of 500–550 nm. The external solutions were seamlessly switched by using a stage-top perfusion system in the following order: pH 6.5, 6.0, 5.5 and recovery to pH 6.5. The pH values of the perfused external solutions are shown above the psudocolored fluorescence ratio images. Interval: 10 sec. The total duration: 6 min 20 sec (39 frames). Scale bar: 10 μm.

