Figure 1.
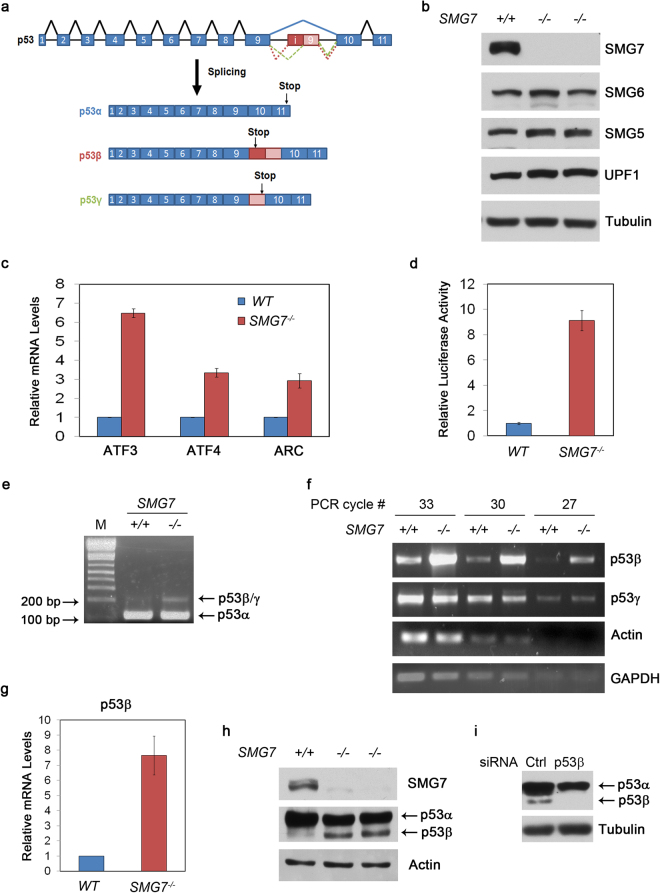
Loss of SMG7 results in NMD deficiency and upregulation of p53β. (a) Scheme depicting the splicing of the p53 transcript into p53 α, β, and γ isoforms. (b) Characterization of HCT116 wild-type and SMG7 −/− cells (Clone #1 & #234) via western blot analysis specifically NMD core factor expression. (c) qPCR analysis of known NMD targets (ATF3, ATF4, & ARC, Supplemental Table 2) in HCT116 WT and SMG7 −/− cells, (n = 3). (d) Assessment of NMD function via NMD luciferase assay as previously described (pCL-Neo β-globin WT Renilla, pCL- Neo β-globin NT39 Mutant Renilla, and pCL- Neo Firefly)35. Persistence of luciferase indicates the absence of NMD decay of the transcript in HCT116 WT and SMG7 −/− cells. Renilla Luciferase signals were normalized to Firefly Luciferase controls, (n = 6). (e) RT-PCR for amplification of p53 isoform mRNA using primers spanning exon 9 and exon 10 (Supplemental Table 2). Inclusion of intron i9 (β or γ) would generate PCR fragments of larger sizes. (f) Nested semi-quantitative PCR (Supplemental Table 2) of p53 isoforms as previously described36 in HCT116 WT and SMG7 −/− cells. Samples were run at various cycle numbers (33, 30, 27) to ensure linear amplification. (g) qPCR analysis of p53β levels in HCT116 WT and SMG7 −/− cells (Supplementary Table 2), (n = 8). (h) Western blot analysis of HCT116 WT and SMG7 −/− cells for p53 isoform expression, with p53 antibody (α, β, or γ) β-actin. (i) Identification of the lower p53 protein band as p53β. SMG7 −/− cells were transfected with p53β specific siRNA (Supplementary Table 1,18). Western blot analysis of p53 was carried out as in (h).

