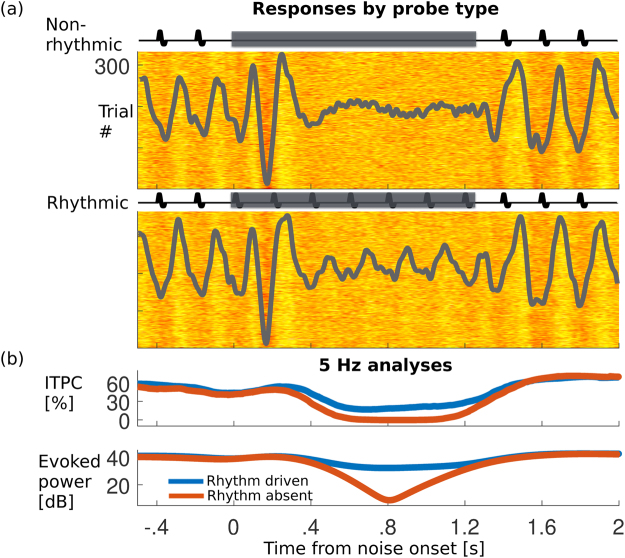
Figure 1.
Neural representations of rhythm in noise versus tone in noise from a representative subject. (a) MEG responses before, during, and after a noise probe are shown, from a single MEG data-driven, scalp-distributed virtual sensor constructed via spatial filtering; see Methods and Supplementary Fig. 1. The basic stimulus consists of a 5 Hz pulsatile (short duty-cycle) FM tone, centered at f 0 = 1024 Hz, to which 1.24 s noise probes were applied. Insets: illustration of a non-rhythmic probe where pulses are replaced by the constant tone (top); and a rhythmic probe, where the FM continues under the noise (bottom). Before and after the probes, phase locking to the main rhythmic stimulus is apparent even on a per-trial basis. Overlaid on each response raster, evoked activity (averaged separately for each probe type) reveals a measurable aSSR during rhythmically-driven probes (top) but not during rhythm-absent probes (bottom). (b) Top: Phase analysis at 5 Hz shows estimated phase-locking over time as measured by ITPC. During masking, ITPC values drop to near floor in rhythm absent probes (orange) but only to half of baseline levels in rhythm-driven probes (blue). Bottom: Analysis of spectral power (also at the 5 Hz rhythm rate) also shows considerable difference between probe types for this subject.

