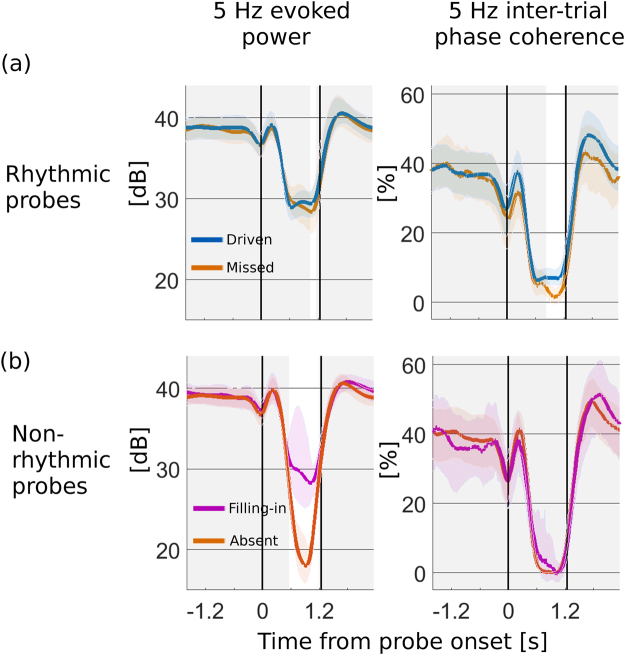
Figure 2.
Percept-specific representations of patterned sound. Grand averages (N = 35) of rhythmic evoked power and intertrial phase coherence partitioned by probe type and reported percept, from MEG virtual sensor channel. Noise probe starts at the first vertical line at t = 0 s and continues until the next vertical line at t = 1.24 s. (a) Rhythmic probes: (Left) During masking, rhythmic evoked power drops by 9.5 dB in average, holding relatively steady for the duration of the probe. (Right) Similarly, inter-trial phase coherence drops by about 81% for the duration of the probe. For probes in which the rhythm was missed (brown), however, both evoked power and ITPC showed an additional reduction (only near the end of the probe) compared to rhythmically-driven probes (blue). (b) Non-rhythmic probes: (Left) After an initial transient, rhythmic evoked power was reduced regardless of percept, but differentially by 7.9 dB depending on percept as present (magenta), or absent (orange). (Right) No significant difference was observed for ITPC, where there was a reduction to near floor during the probe. Solid lines: mean across subjects and trials; Color bands: bootstrap 95% confidence of the mean over subjects; Grey bands: time intervals with no significant difference by percept.

