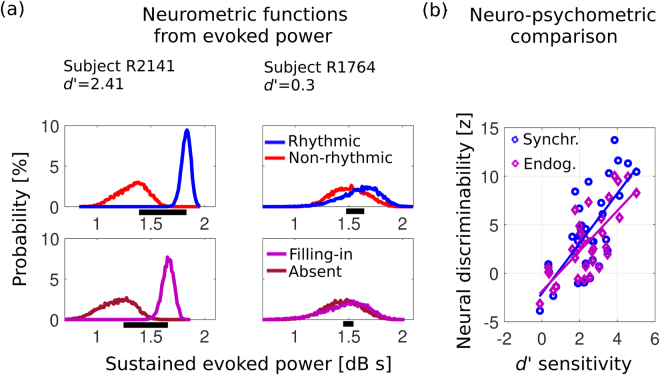
Figure 3.
. Rhythmic target power acts as a discriminant neural statistic for perceived rhythm. (a) Top: In two representative subjects, behavior covaries with empirically-derived neural discriminability distributions. Probability distributions of a given level of sustained (time-integrated) evoked power depend on the acoustic presence (blue) or absence (red) of stimulus rhythmic FM; a neural discriminability score (proportional to horizontal black bar length) can be obtained from them. In the first subject (left panel), the small overlap between the distributions gives high neural discriminability; for the second subject (right panel), both distributions overlap substantially, giving poor discriminability. Bottom: Next, empirically-derived neural distributions were obtained only from non-rhythmic probes (i.e., the red curves in the top panels), now conditioned instead by percept. A similar pattern in the distributions is observed. Distributions obtained via bootstrap. (b) Over subjects, the psychometric d’ sensitivity index (abscissa) correlates with the neurometric discriminability index based on acoustic contrast (rhythmic versus non-rhythmic probe, blue; ρ = 0.73, p = 1.0 × 10⁻⁶). Critically, behavioral sensitivity to ‘filling-in’ also correlates with rhythmic evoked power differences despite the absence of stimulus rhythm via the related neurometric discriminability index based on perceptual contrast (filling-in versus reported absent, magenta; ρ = 0.69, p = 6.1 × 10⁻⁶).

