
Figure 7.
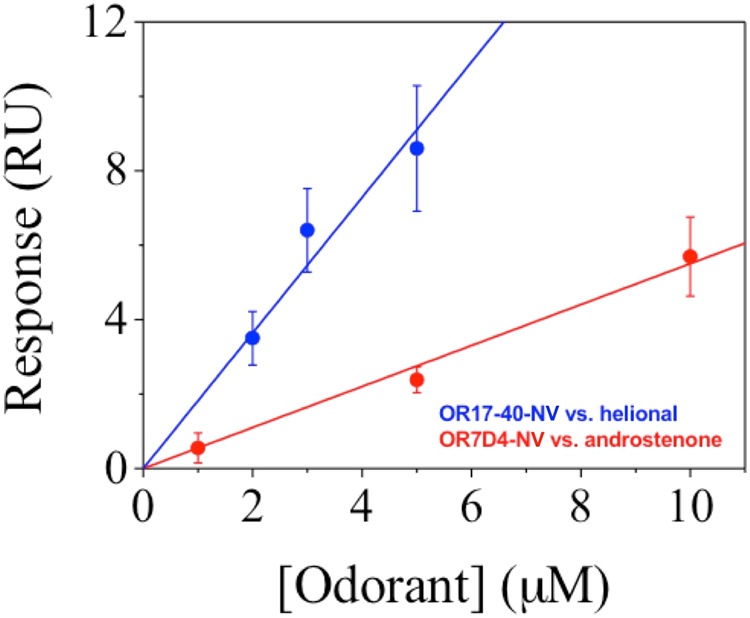
SPR response of OR17-40-NV vs. helional concentration (data in blue) and of OR7D4-NV vs. androstenone concentration (data in red). The corresponding linear fits give: y = 1.82·x (blue line) and y = 0.55·x (red line).
Official websites use .gov
A
.gov website belongs to an official
government organization in the United States.
Secure .gov websites use HTTPS
A lock (
) or https:// means you've safely
connected to the .gov website. Share sensitive
information only on official, secure websites.
SPR response of OR17-40-NV vs. helional concentration (data in blue) and of OR7D4-NV vs. androstenone concentration (data in red). The corresponding linear fits give: y = 1.82·x (blue line) and y = 0.55·x (red line).