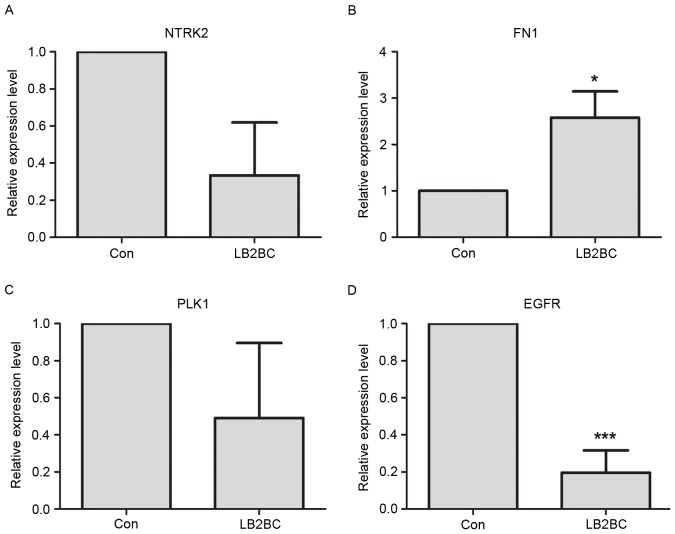
Figure 3.
Reverse transcription-quantitative polymerase chain reaction validation of DEGs between LB2BC tumor and adjacent tissue samples. Relative expression of (A) NTRK2, (B) FN1, (C) PLK1, (D) EGFR. *P<0.05; ***P<0.001 vs. Con. LB2BC, luminal B2 breast cancer; NTRK2, neurotrophic receptor tyrosine kinase 2; FN1, fibronectin-1; PLK1, Polo-like kinase 1; EGFR, epidermal growth factor receptor; CON, adjacent healthy control tissue.

