
Figure 5.
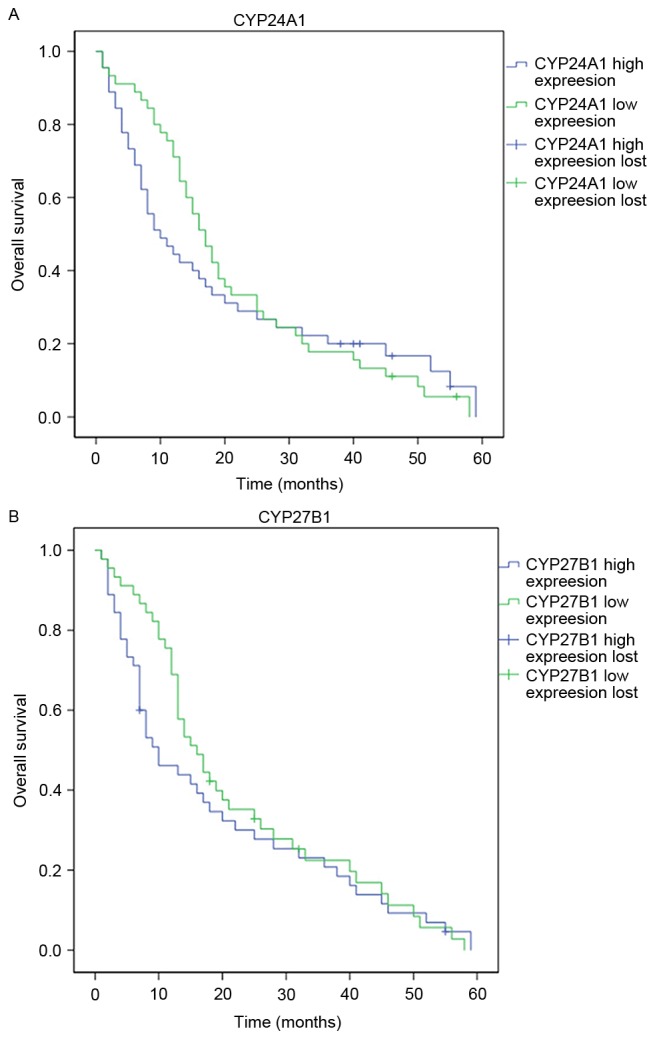
Kaplan-Meier curve analysis of overall survival in patients with high or low expression of (A) CYP24A1 or (B) CYP27B1. CYP24A1, Cytochrome P450 Family 24 Subfamily A Member 1; CYP27B1, Cytochrome P450 Family 27 Subfamily B Member.
Official websites use .gov
A
.gov website belongs to an official
government organization in the United States.
Secure .gov websites use HTTPS
A lock (
) or https:// means you've safely
connected to the .gov website. Share sensitive
information only on official, secure websites.
Kaplan-Meier curve analysis of overall survival in patients with high or low expression of (A) CYP24A1 or (B) CYP27B1. CYP24A1, Cytochrome P450 Family 24 Subfamily A Member 1; CYP27B1, Cytochrome P450 Family 27 Subfamily B Member.