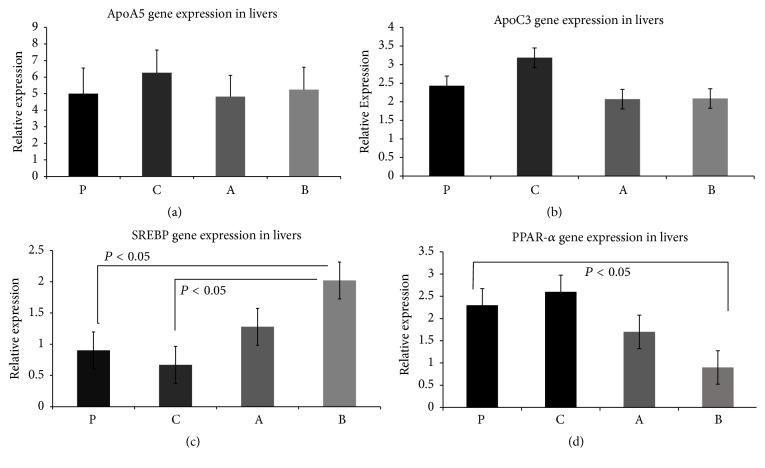
Figure 3.
(a) ApoA5 is significantly upregulated in the linoleic acid control group (C group). P group (Standard Chow), C group (chow supplemented with linoleic acid 9 mg/mouse/day), A group (chow supplemented with oxidized linoleic acid 9 mg/mouse/day), and B group (chow supplemented with linoleic acid 18 mg/mouse/day). (b) ApoC3 is nonsignificantly upregulated in the linoleic acid control group (C group). P group (Standard Chow), C group, A group (chow supplemented with oxidized linoleic acid 9 mg/mouse/day), and B group (chow supplemented with linoleic acid 18 mg/mouse/day). (c) SREBP gene expression shows significant upregulation in the mice group fed a high concentration of oxidized linoleic acid. P group (Standard Chow), C group (chow supplemented with linoleic acid 9 mg/mouse/day), A group (chow supplemented with oxidized linoleic acid 9 mg/mouse/day), and B group (chow supplemented with linoleic acid 18 mg/mouse/day). (d) Slight peak in the PPAR-α gene expression in the linoleic acid control group (C group) and decreased expression in both oxidized linoleic acid concentration groups (A and B groups): P group (Standard Chow), C group (chow supplemented with linoleic acid 9 mg/mouse/day), A group (chow supplemented with oxidized linoleic acid 9 mg/mouse/day), and B group (chow supplemented with linoleic acid 18 mg/mouse/day).

