Figure 2.

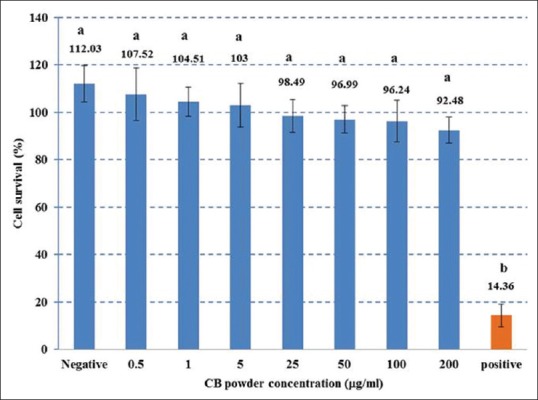
Cell viability percentages in the CBP, negative control, and positive control groups. Different superscript letters signify a significant difference between groups (P < 0.05)

Cell viability percentages in the CBP, negative control, and positive control groups. Different superscript letters signify a significant difference between groups (P < 0.05)