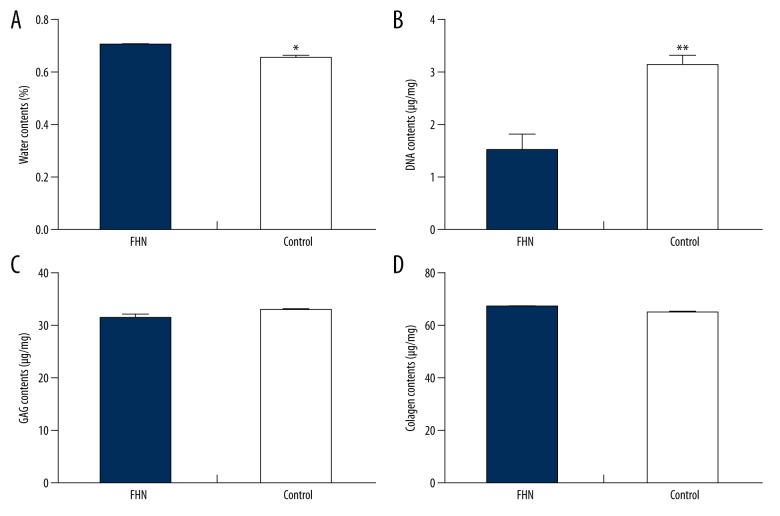
Figure 4.
Biochemical composition analysis of femoral head cartilage. (A) Water content in the FHN group was significantly higher than that in the Control group. (B) DNA content in the FHN group was significantly lower than that in the Control group. (C, D) The content of GAG in the FHN group was slightly lower than that in the Control group, and the total collagen content in the FHN group was slightly higher than that in the Control group, but there was no detectable significant difference (P>0.05).

