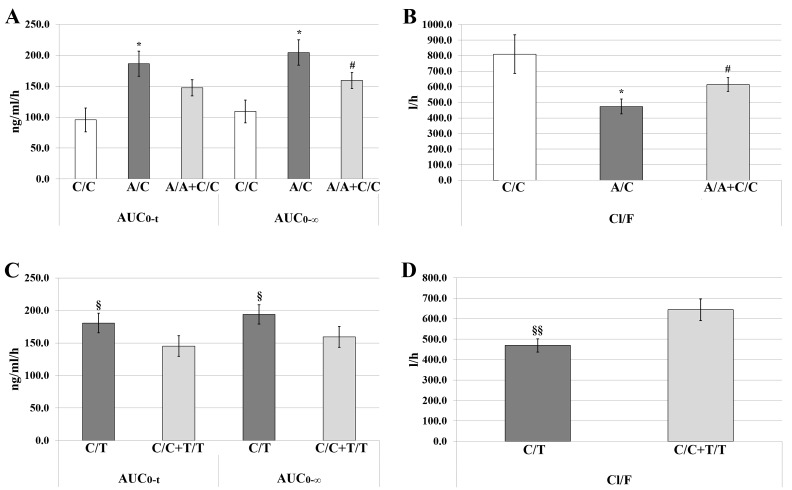
Figure 2.
AGTR1 and BDKRB2 genotypes based on atorvastatin pharmacokinetics. (A) Mean values of AUC0-t and AUC0-∞ for the genotypes and genotype combinations of AGTR1-rs5186; (B) mean values of Cl/F for the genotypes and genotype combinations of AGTR1-rs5186; (C) mean values of AUC0-t and AUC0-∞ for the genotypes and genotype combinations of BDKRB2-rs1799722; (D) mean values of Cl/F for the genotypes and genotype combinations of BDKRB2-rs1799722. Data are presented as the mean ± standard error. *P<0.05 vs. C/C; #P<0.05 vs. A/C; §P<0.05 and §§P<0.01 vs. C/C+T/T. AGTR1, angiotensin II type 1 receptor; BDKRB2, bradykinin B2 receptor; AUC, area under the plasma concentration-time curve; AUC0-t, AUC from time 0 to the time of last measurement; AUC0-∞, AUC from time 0 extrapolated to infinity; Cl/F, apparent clearance of the fraction dose absorbed.

