Figure 3.
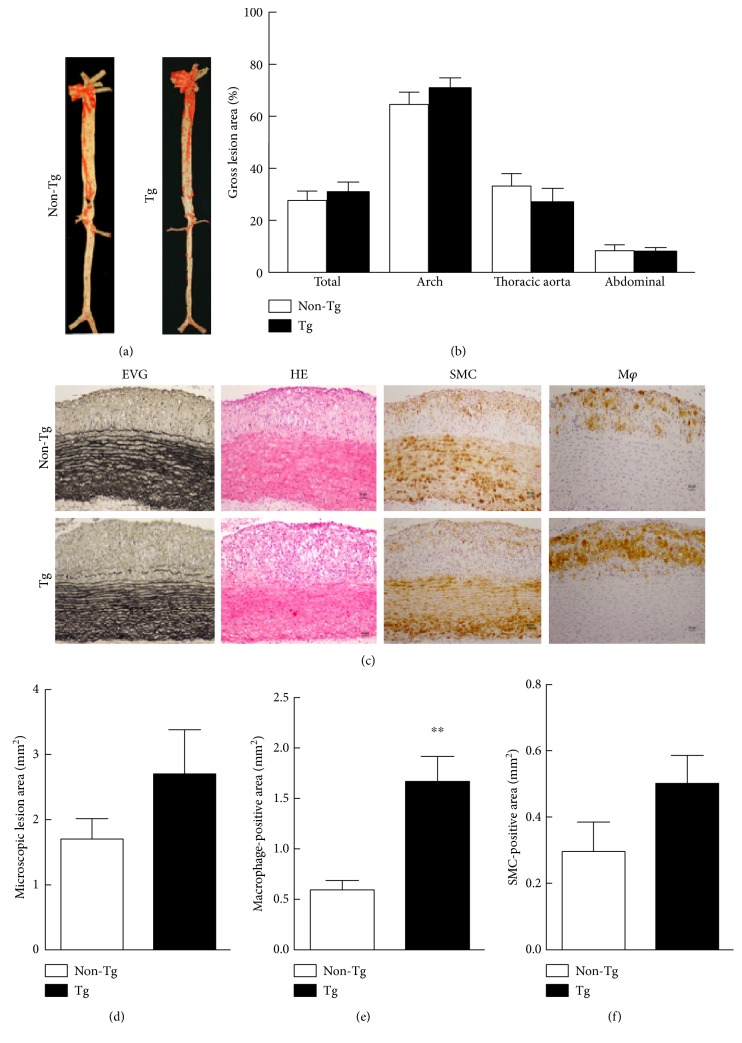
Representative aortic atherosclerosis lesions and their quantitative analysis. (a) “Aortic trees” were stained with Sudan IV. (b) Quantitative analysis of the atherosclerotic arterial lesions. (c) Aortic sections were stained with Elastica van Gieson (EVG) and hematoxylin and eosin (H&E) or immunohistochemically stained with Abs against macrophages (Mφ) or smooth muscle cells (SMCs). The quantitative analysis of the aortic arch lesion area (d), the cellular composition of the Mφ, and SMCs are shown at the bottom (e, f). n = 12 for each group. Data are expressed as the mean ± SEM. ∗∗P < 0.01 versus non-Tg.

