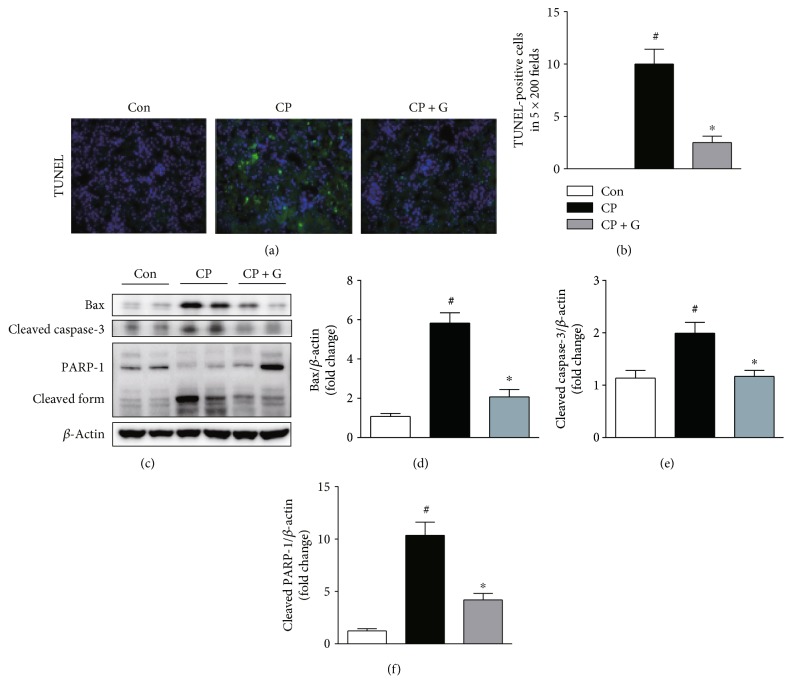
Figure 4.
Effects of gemigliptin pretreatment on cisplatin-induced apoptotic cell death in the kidneys. (a) TUNEL staining (×200). (b) The number of TUNEL-positive cells in 5 fields (×200). (c) Western blot analysis of the expression of Bax, cleaved caspase-3, cleaved PARP-1, and β-actin in the kidneys. The graphs showing the results of quantitative analysis of Bax (d), cleaved caspase-3 (e), and cleaved PARP-1 (f) among groups. Con: control, n = 6; CP: cisplatin, n = 6; and CP + G: cisplatin + gemigliptin, n = 6. All data are expressed as the mean ± SEM. #P < 0.01 versus Con and ∗P < 0.01 versus CP.

