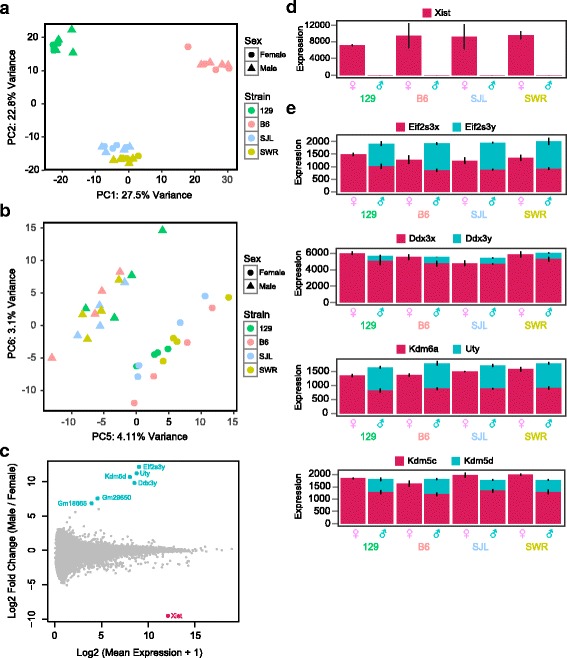
Fig. 1.

Sex linked gene expression in the VNO. a and b Principal components analysis (PCA) of all expressed genes in VNO of B6, 129, SWR and SJL strains. c MA plot of gene expression in VNOs from male and female mice. Y-axis indicates the maximal value of fold change (FC) between male and female in log2 scale. Genes that exhibit significant DE are highlighted in color (weighted FC > 2; p < 0.01). d Bar plot of mean normalized expression of Xist in male and female mice. e Stacked bar plot of mean normalized value of Y chromosome linked genes and their X chromosome homologs. Genes expressed from the X and Y chromosomes are labeled red and teal, respectively. Error bars represent standard deviation of expression values
