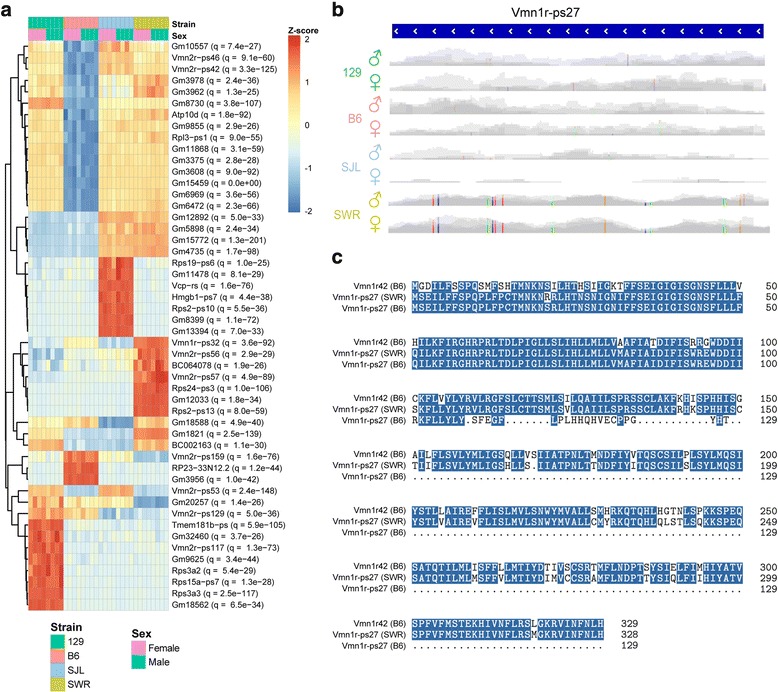
Fig. 4.

Differential expression of pseudogenes and gene model transcripts. a Heatmap of expression profiles of top 50 pseudogenes and gene models that are DE across strains. DE genes are ranked by q-value. b Track view of Vmn1r-ps27. The expression levels are of the same scale and 10 SNVs (color bars) are indicated with base substitutions represented as follows: thymine as red, guanine as brown, cytosine as blue, and adenine as green. c Translated sequence of SWR Vmn1r-ps27 indicates that it is a full-length V1r with 84% identity to Vmn1r42
