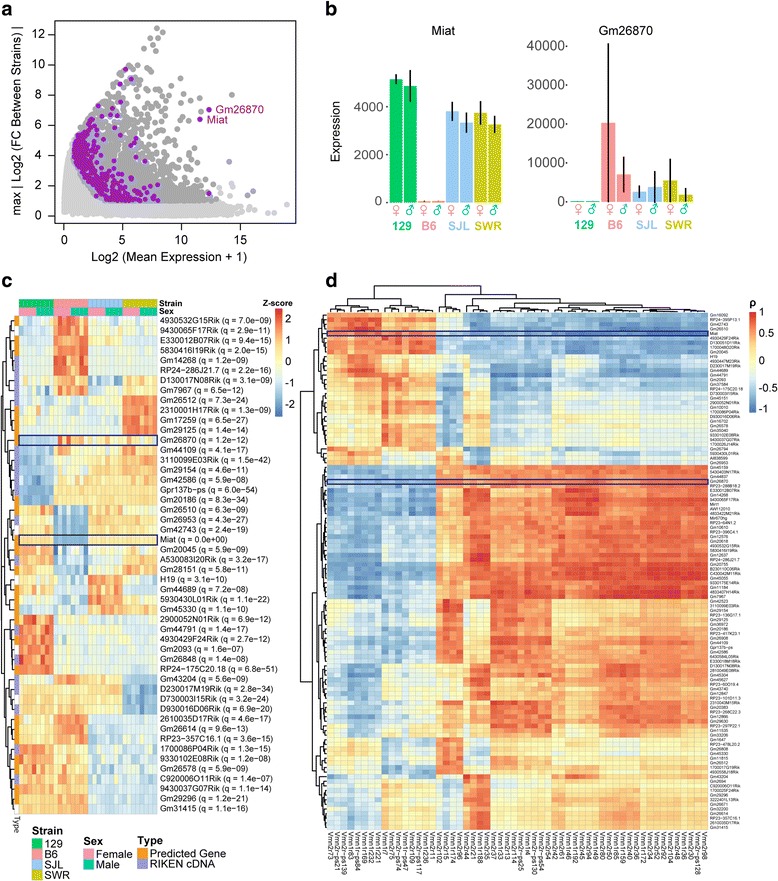
Fig. 6.

Differential expression of lncRNAs. a MA plot highlighting the 446 DE lncRNAs (purple). Y-axis indicates the maximal value of FC between any two strains in log2 scale. b Bar plot of mean normalized expression value of Miat and Gm26870 in all four strains. Error bars represent standard deviation of expression values. c Heatmap showing expression profiles of top 30 lncRNAs. The majority are gene model predictions and Riken transcripts. d Hierarchical analysis showing correlation between a subset of DE lncRNA and DE vomeronasal receptors that correlate highly with one another. Miat and Gm26870 are indicated
