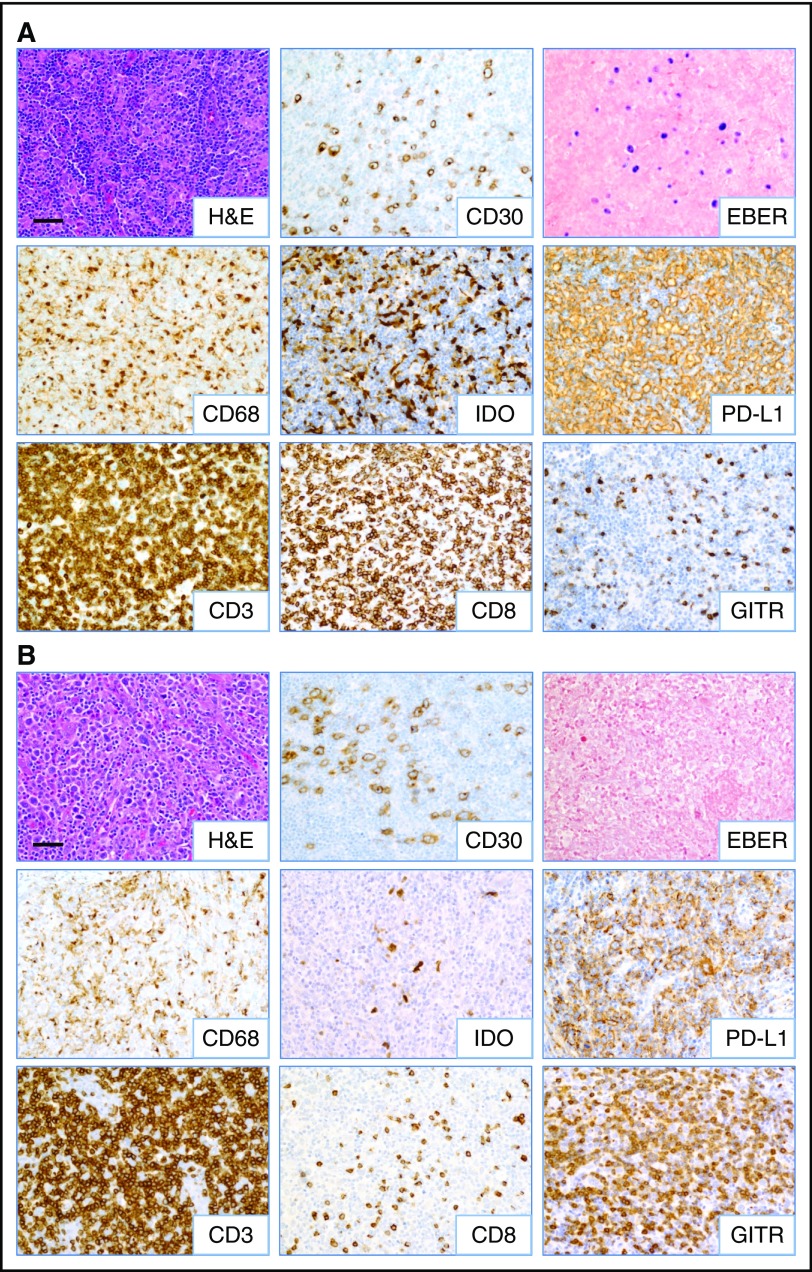
Figure 2.
Inflammatory composition of EBV+and EBV−CHL. Representative images from (A) EBV+ and (B) EBV− CHL (specimens CHL-23 and CHL-12, respectively; see Table 1) are shown. HRS tumor cells are identified by anti-CD30 IHC and EBER ISH. A predominance of CD8+ T cells and IDO+ histiocytes was observed in EBV+ cases, whereas increased GITR+ lymphocytes were seen in EBV− cases. Robust CD3+ T-cell infiltrates and PD-L1 expression on HRS cells and infiltrating immune cells were observed regardless of EBV status. Slides were imaged on an Olympus BX46 microscope with an Olympus DP72 camera at ×200 magnification with an aperture of 0.5, and Olympus cellSens Standard 1.5 image acquisition software was used. Bar, 50 μm. H&E, hematoxylin and eosin.

