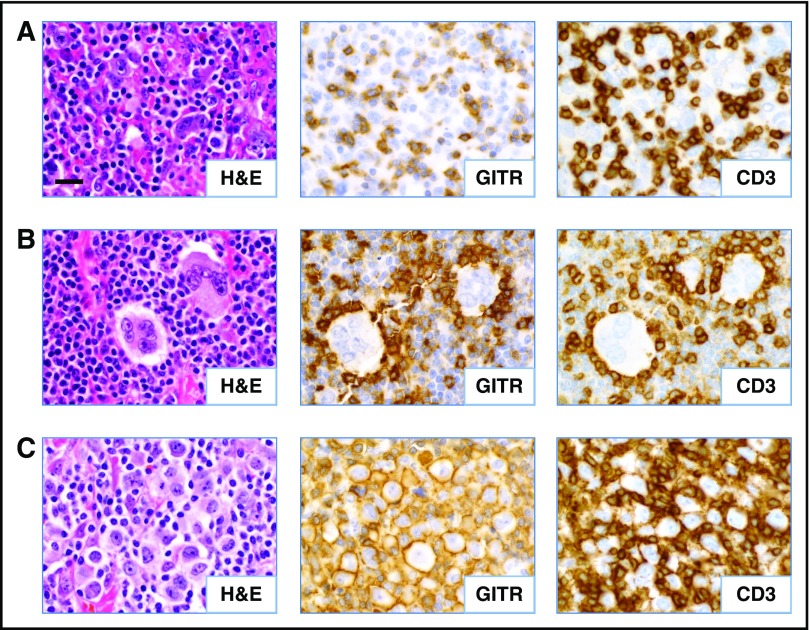
Figure 3.
Patterns of GITR expression observed in CHL. Serial FFPE tumor sections were stained as indicated. (A) Diffuse GITR expression on infiltrating T lymphocytes (case CHL-2). (B) Rosettes of GITR+ T cells surrounding HRS tumor cells (case CHL-19). (C) GITR expression on the plasma membrane of a subset of the HRS cells (case CHL-7). All cases shown are EBV− specimens. Slides were imaged at ×500 magnification with an aperture of 0.9. Bar, 20 μm.

