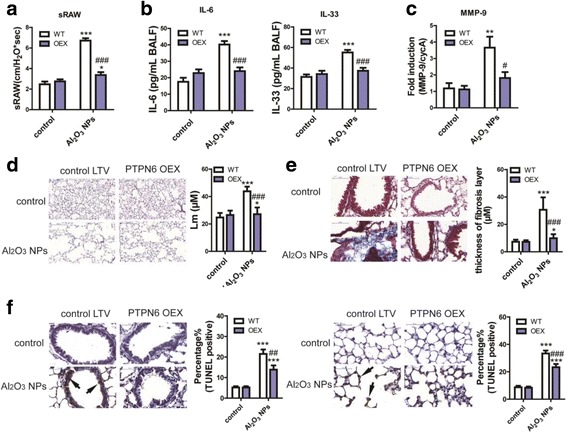
Fig. 5.

Overexpression of PTPN6 rescued experimental COPD in mouse model. a sRAW of conscious mice (n = 10, * P < 0.05, compared with WT control, *** P < 0.001, compared with WT control, ### P < 0.001, compared with Al2O3 NPs-exposed WT mice). b Levels of inflammatory mediators in BALF (n = 4, *** P < 0.001, compared with WT control, ### P < 0.001, compared with Al2O3 NPs-exposed WT mice). c Expression levels of MMP-9 in mouse lungs (n = 6, ** P < 0.01, compared with WT control, # P < 0.05, compared with Al2O3 NPs-exposed WT mice). d Representative images of emphysema and Lm in mouse lungs (n = 36, * P < 0.05, compared with WT control, *** P < 0.001, compared with WT control, ## P < 0.01, compared with Al2O3 NPs-exposed WT mice). e Representative images of airway remodeling and thickness of fibrosis layer around airway in mouse lungs (n = 36, * P < 0.05, compared with WT control, *** P < 0.001, compared with WT control, ### P < 0.001, compared with Al2O3 NPs-exposed WT mice). f Representative images of TUNEL staining and percentage of TUNEL+ cells in airway epithelia and alveolar epithelia (n = 30, *** P < 0.001, compared with WT control, ## P < 0.01, ### P < 0.001, compared with Al2O3 NPs-exposed WT mice)
