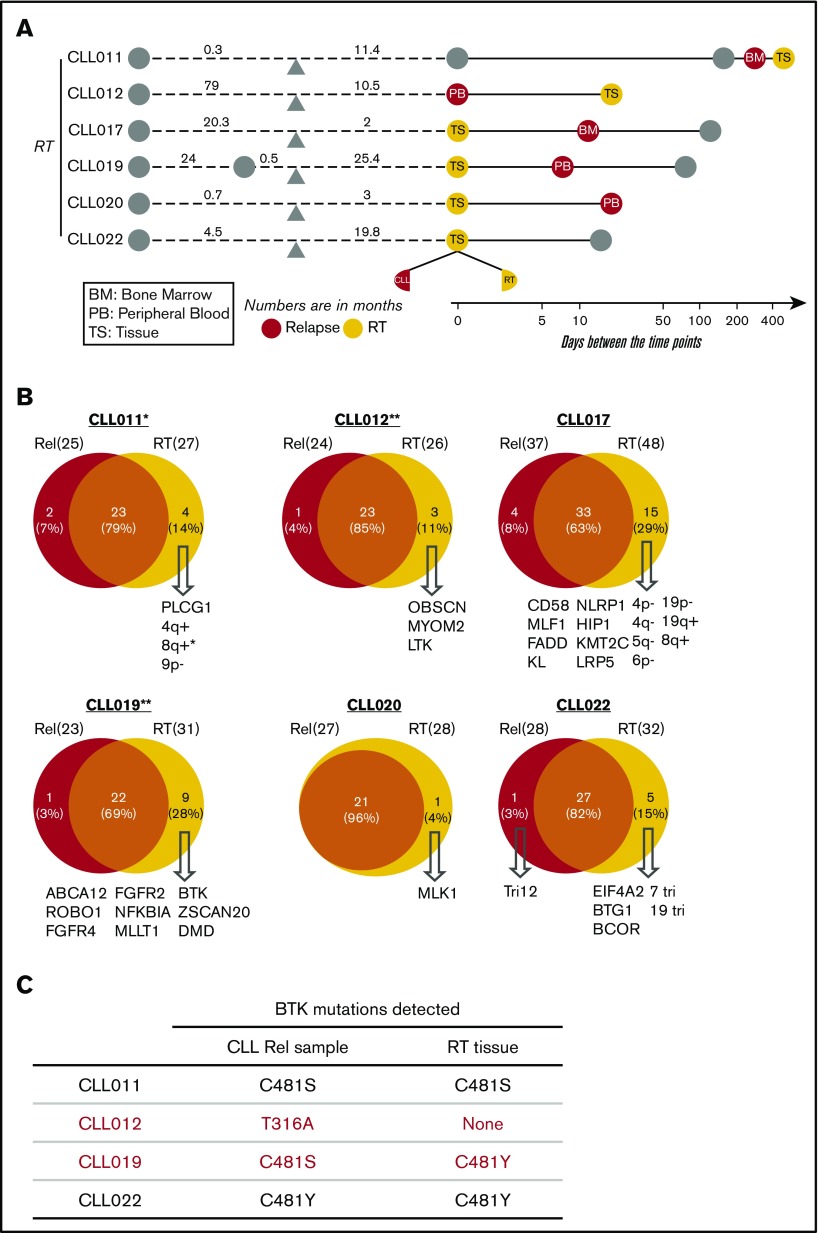
Figure 4.
Clonal evolution in CLL-RT transition. (A) Schematic representation of the paired samples used for this analysis: orange for RT and red for liquid sample. (B) Venn diagrams comparing the genetic lesions in the paired RT and relapse samples of each patient. Numbers indicates counts of mutations. (C) Comparison of BTK mutations present in CLL vs RT tissue. *CLL011 showed gains of MYC in liquid relapse sample (Rel), but the copy number was further increased in the RT tissue. **No CNA data were available from the RT samples of patients CLL012 and CLL019. Tri, trisomy.

