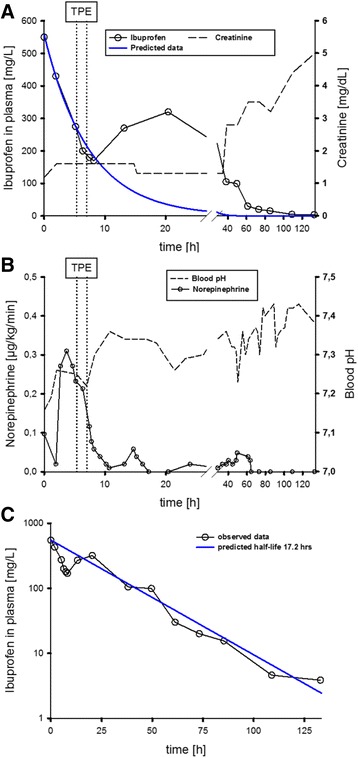
Fig. 1.

a Shown are the measured ibuprofen plasma concentration (IPC) ( ), creatinine-level (--) and predicted IPC (
 ) over time (from ICU admission until day 5). TPE (
 ) was applied for about one hour. For simulation of early phase disposition, a one-compartment model with bolus input and 1st order elimination rate was used [C=Co * e(exp(-k * t)); Phoenix WinNonlin 6.3, Pharsight, Mountain View, CA]. This model provided an almost “pseudo-normal” elimination half-life of 5.1 h. b Shown are the applied norepinephrine dose (
 ) in relation to the blood pH (--) over time. Acidosis improvement was not correlated with the norepinephrine dose (b). c Measured ibuprofen plasma concentration (IPC) (
 ) and predicted IPC (
 ) over time (from ICU admission until day 5, linear x-axis). For estimation of the overall elimination rate, a non-compartmental analysis (NCA) was performed. Within the NCA model a linear trapezoidal calculation method with linear interpolation was used. The NCA model provided an estimated overall elimination half-life of 17.2 h
