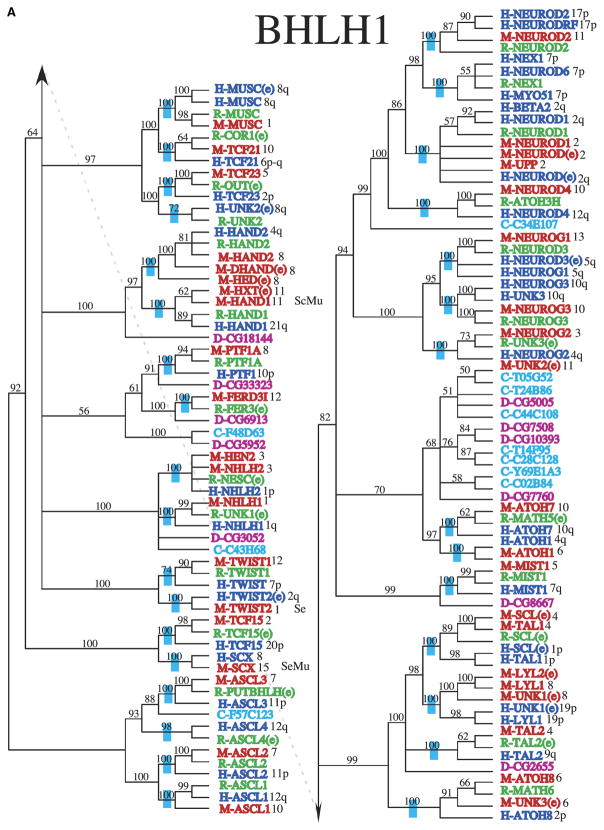
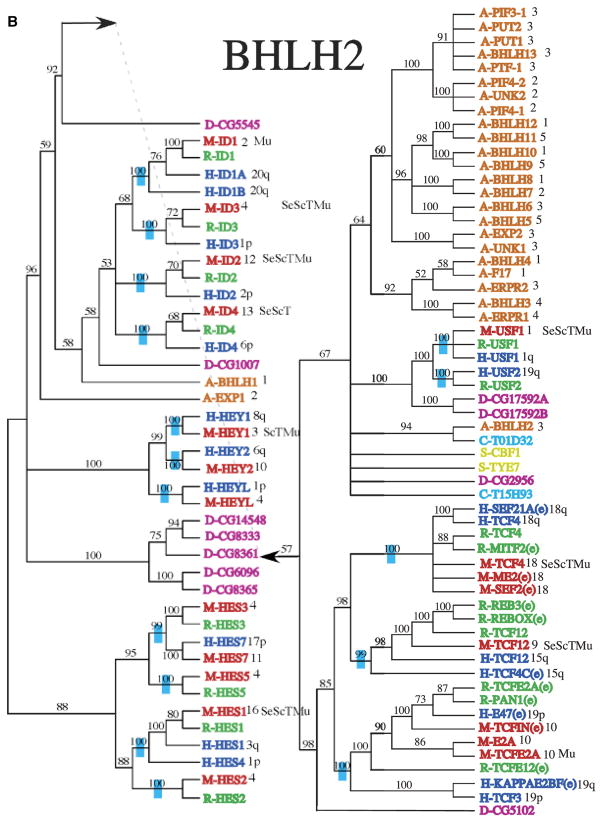
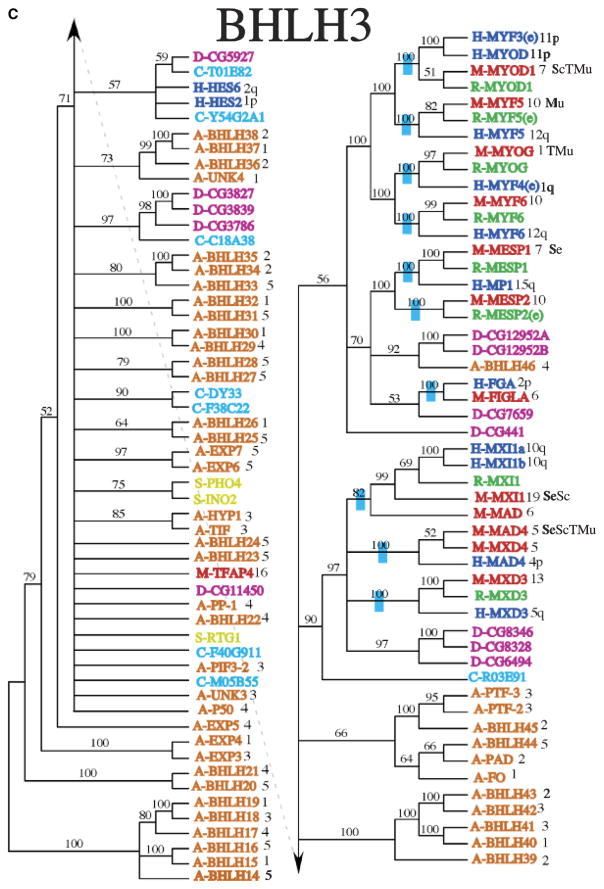
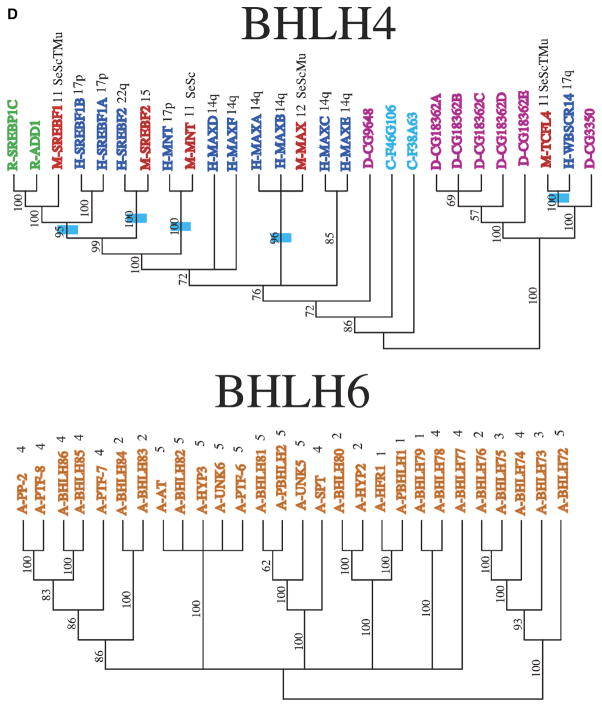
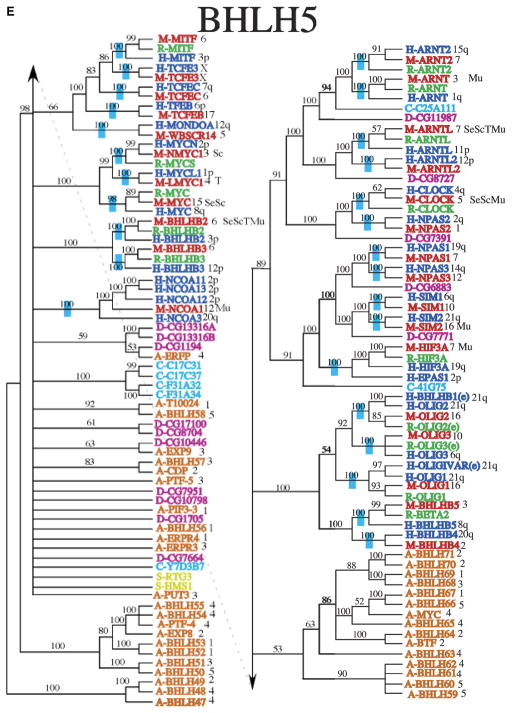
Fig. 2.
Phylogenetic relationship of individual genes in (A) clade 1, (B) clade 2, (C) clade 3, (D) clade 4 and 6, and (E) clade 5 with relatedness as determined by Bayesian posterior probability indicated by the blue hatch bar and number to the left of the genes. Chromosomal location for mouse and human genes is given to the right of the gene names. The species is indicated by blue (human), green (rat), red (mouse), magenta (Drosophila), pink (C. elegans), and orange (Arabidopsis), with the species letter in front of the name.

