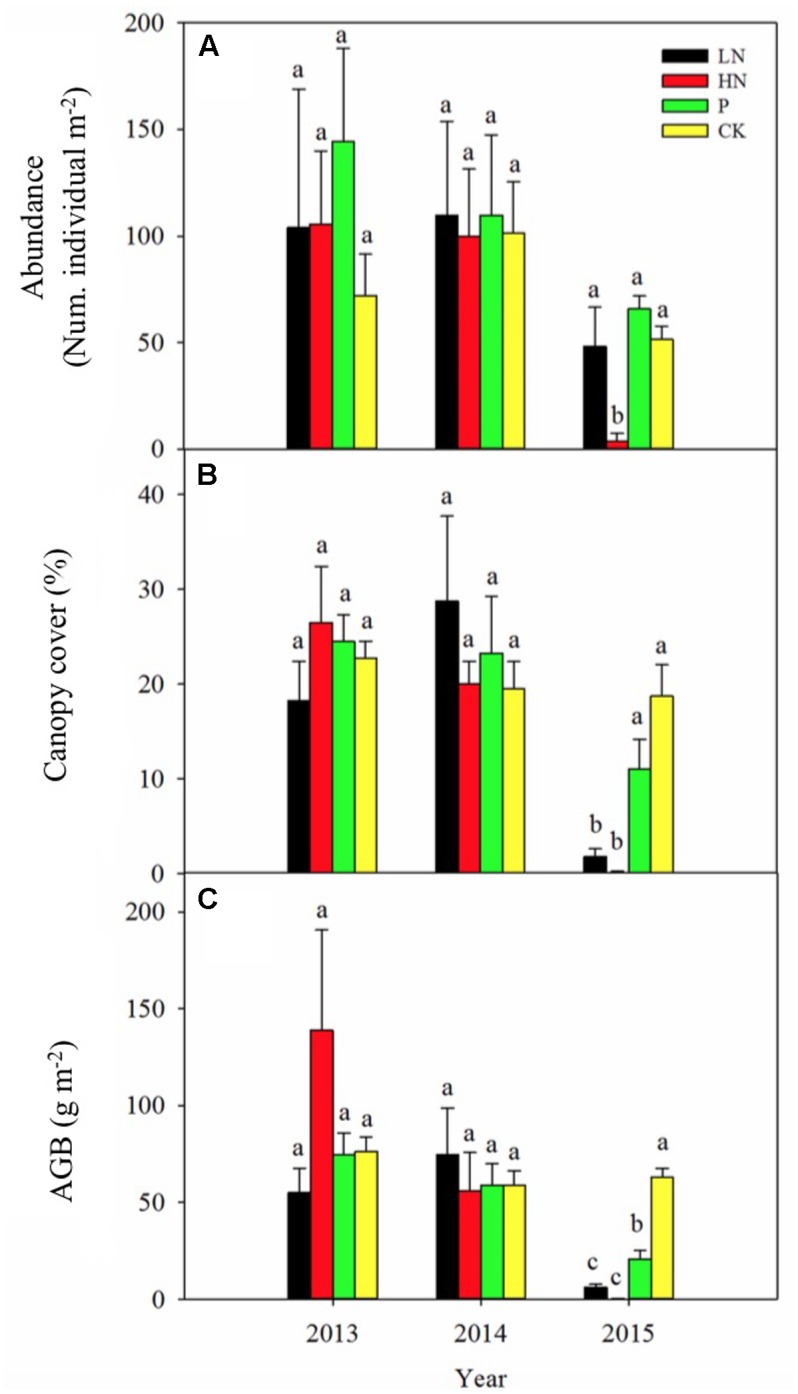
FIGURE 1.

Plant abundance (A), canopy cover (B) and above-ground biomass (AGB; C) of Pedicularis kansuensis under various fertilization regimes before (2013) and after (2014 and 2015) fertilization. Different letters indicate significant differences between treatments within the same year at P < 0.05, n = 4. Values are presented as means ± SE. Fertilization regimes: CK, unfertilized control; LN, fertilized with lower nitrogen level; HN, fertilized with higher nitrogen level; P, fertilized with phosphorus.
