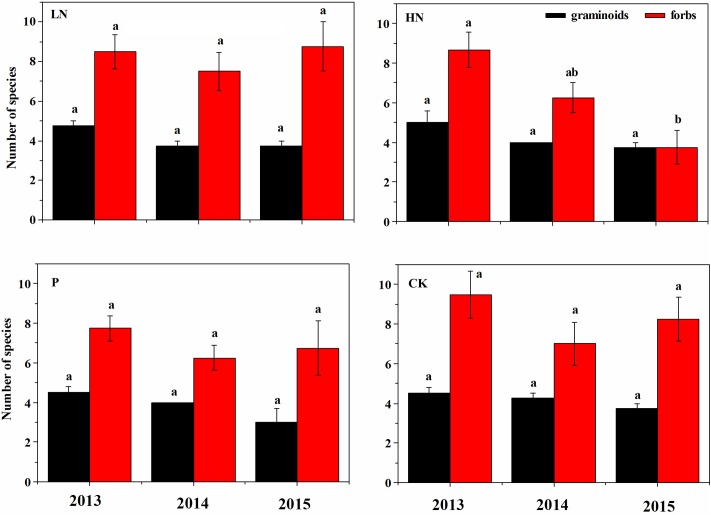
FIGURE 3.
Number of graminoids and forbs species under various fertilization regimes before (2013) and after (2014 and 2015) fertilization. Different letter indicates significant difference between years of observation at P < 0.05, n = 4. Values are presented as means ± SE. Fertilization regimes: CK, unfertilized control; LN, fertilized with lower nitrogen level; HN, fertilized with higher nitrogen level; P, fertilized with phosphorus.

