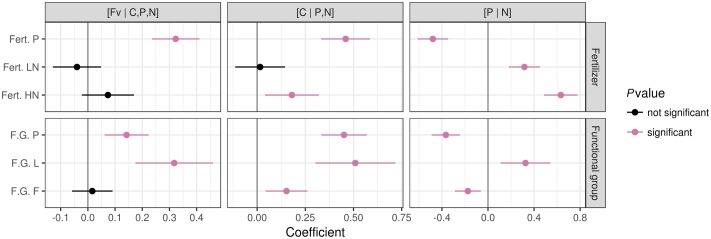
FIGURE 6.
Patterns of foliar nutrient balances under different fertilization regimes and in different functional plant groups. Data from unfertilized blocks were used as a reference for fertilization treatments. Data from graminoids were used as a reference for other plant functional groups. The significance was tested at P < 0.05. Notes: Fert. P, fertilized with P at a rate of 100 kg Ca(H2PO4)2 ha-1; Fert. LN, fertilized with low N level at a rate of 30 kg N ha-1 as urea; Fert. HN, fertilized with high N level at a rate of 90 kg N ha-1 as urea; F.G., functional plant groups; P, Pedicularis kansuensis; L, legumes; F, forbs.

