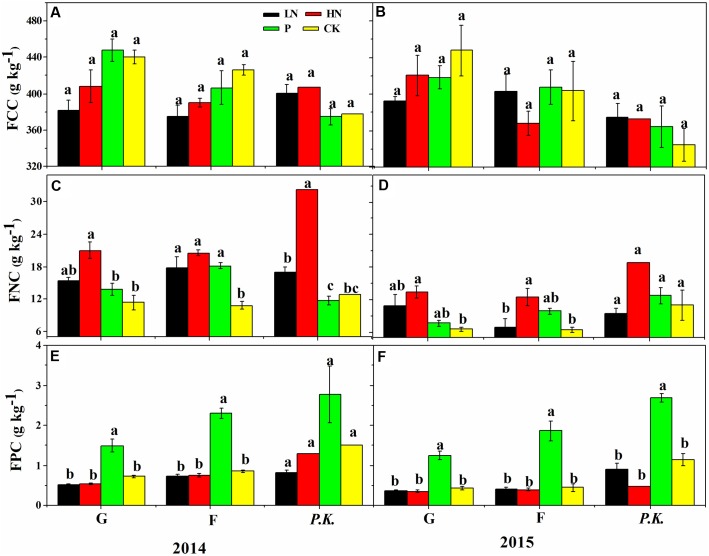
FIGURE 7.
Foliar element concentrations of different plant groups under different nutrient supply regimes in the first (2014) and second (2015) growing season after fertilization. (A,B) Foliar carbon concentration (FCC, g kg-1); (C,D) foliar nitrogen concentration (FNC, g kg-1); (E,F) foliar phosphorous concentration (FPC, g kg-1). G, graminoids; F, forbs; P.K., P. kansuensis. Data are presented as means ± SE of four replicates. Bars with different letters indicate significant difference at P < 0.05 level. Fertilization regimes: CK, non-fertilized control; LN, fertilized with lower nitrogen level; HN, fertilized with higher nitrogen level; P, fertilized with phosphorus.

