
Figure 1. Time to development of diabetic retinopathy among youth with Type 1 and Type 2 diabetes mellitus.
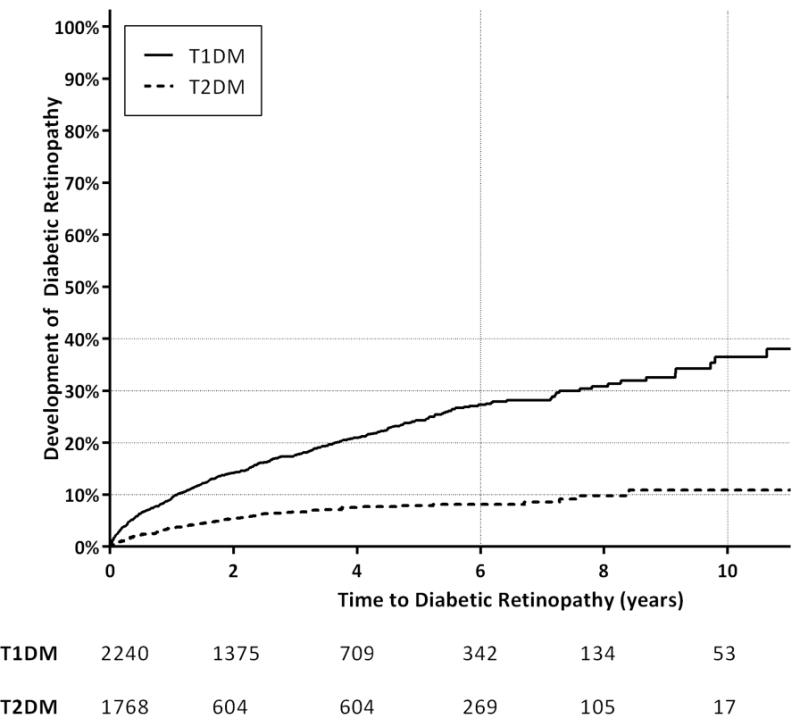
Kaplan-Meier plot depicts the number of years to development of diabetic retinopathy from initial diagnosis of diabetes for youth with Type 1 diabetes mellitus (T1DM) and Type 2 diabetes mellitus (T2DM) (p<0.0001, Log-Rank). The table below the figure shows the number of individuals at risk for development of retinopathy at corresponding time points on the horizontal time axis.