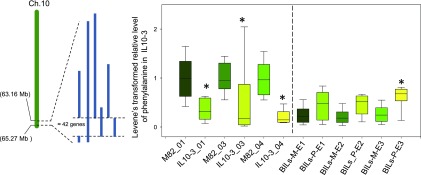
Figure 6.
Validation of Putative cmQTL for Phenylalanine in IL10-3 Using the BIL Population.
Box plots of relative abundance of phenylalanine in IL10-3 after Levene’s transformation (left panel) and the validation using BILs (right panel). On the y axis, the left panel represents the relative abundance of metabolites after Levene’s transformation. Data from three independent harvest seasons (2001, 2003, and 2004) are shown. The right panel represents the analyzed overlapping BIL genotypes from three independent environments. Data are represented as box plots and display the full range of variation from minimum to maximum (n > 6). E, environment followed by the harvest year; 01, from year 2001; 03, from year 2003; 04, from year 2004; BILs-M-E1, backcross inbred lines that have the M82 genomic segments in this region and grew in environment (harvest) 1; BILs_P E1, backcross inbred lines that have S. pennellii segments in this region and grew in environment (harvest) 1.

