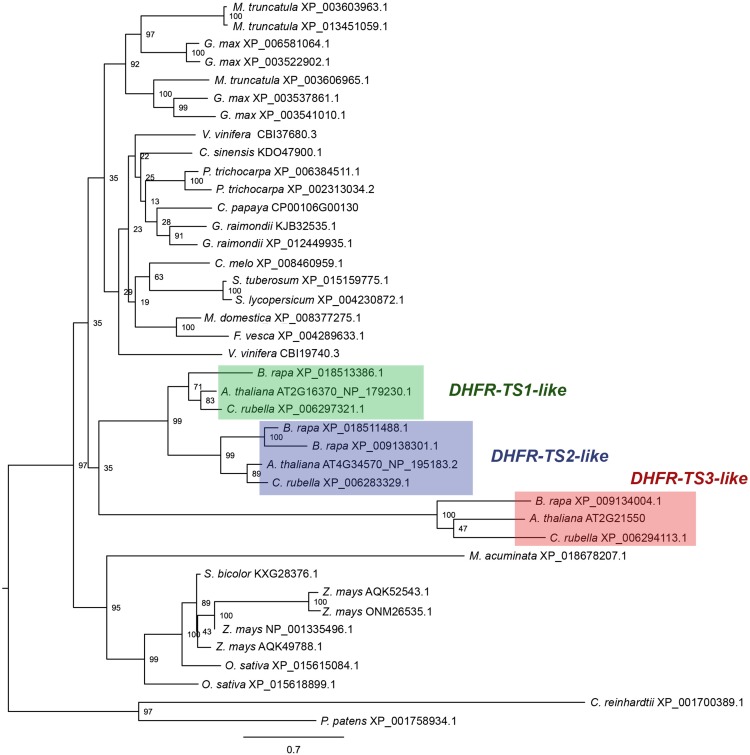
Figure 2.
Phylogenetic Analysis.
Amino acid sequence alignment was obtained using MUSCLE software (Edgar, 2004). The dendrogram was generated using RAxML (Stamatakis, 2014). The numbers at the branching points indicate the percentage of times that each branch topology was found during bootstrap analysis (n = 1000). Species names are followed by protein identifiers. The bar indicates the mean distance of 0.7 changes per amino acid residue.

