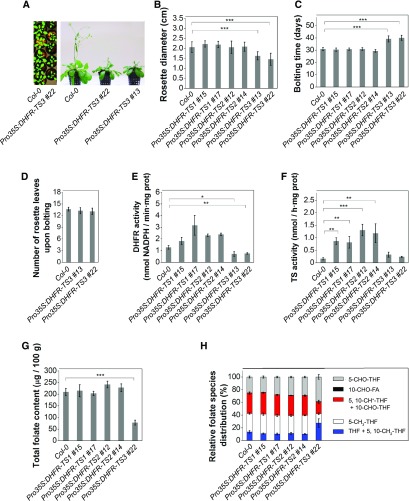
Figure 6.
Functional Characterization of DHFR-TS Gain-of-Function Lines.
(A) Pro35S:DHFR-TS3 demonstrate a delay in development, 3-week-old (left) and 5-week-old (right) plants.
(B) Rosette diameter of 2-week-old plants. Data are mean of at least 15 measurements ± sd.
(C) and (D) Bolting time of the wild type, Pro35S:DHFR-TS1, Pro35S:DHFR-TS2, and Pro35S:DHFR-TS3 gain-of-function lines (C) and number of leaves upon bolting in wild-type and Pro35S:DHFR-TS3 gain-of-function plants (D). Data are mean of at least 15 measurements ± sd.
(E) DHFR activity in 3-d-old Pro35S:DHFR-TS1, Pro35S:DHFR-TS2, and Pro35S:DHFR-TS3 gain-of-function and wild-type seedlings. DHFR activities are representative data from two independent experiments (mean of three biological replicates ± sd, n > 500 seedlings). DHFR activity was determined as the consumption of NADPH measured as the decrease of absorbance at 340 nm.
(F) TS activity in 3-d-old Pro35S:DHFR-TS1, Pro35S:DHFR-TS2, and Pro35S:DHFR-TS3 gain-of-function and wild-type seedlings. Data are mean of three biological replicates ± sd (n > 500 seedlings).
(G) and (H) Total folate content (G) and folate species distribution (H) in 3-d-old Pro35S:DHFR-TS1, Pro35S:DHFR-TS2, and Pro35S:DHFR-TS3 gain-of-function and wild-type seedlings. Data are mean of three biological replicates ± sd (n > 500 seedlings).
Asterisks indicate significant differences with the wild type, as assessed by Student’s t test (*P value < 0.05, **P value < 0.01, and ***P value < 0.001).

