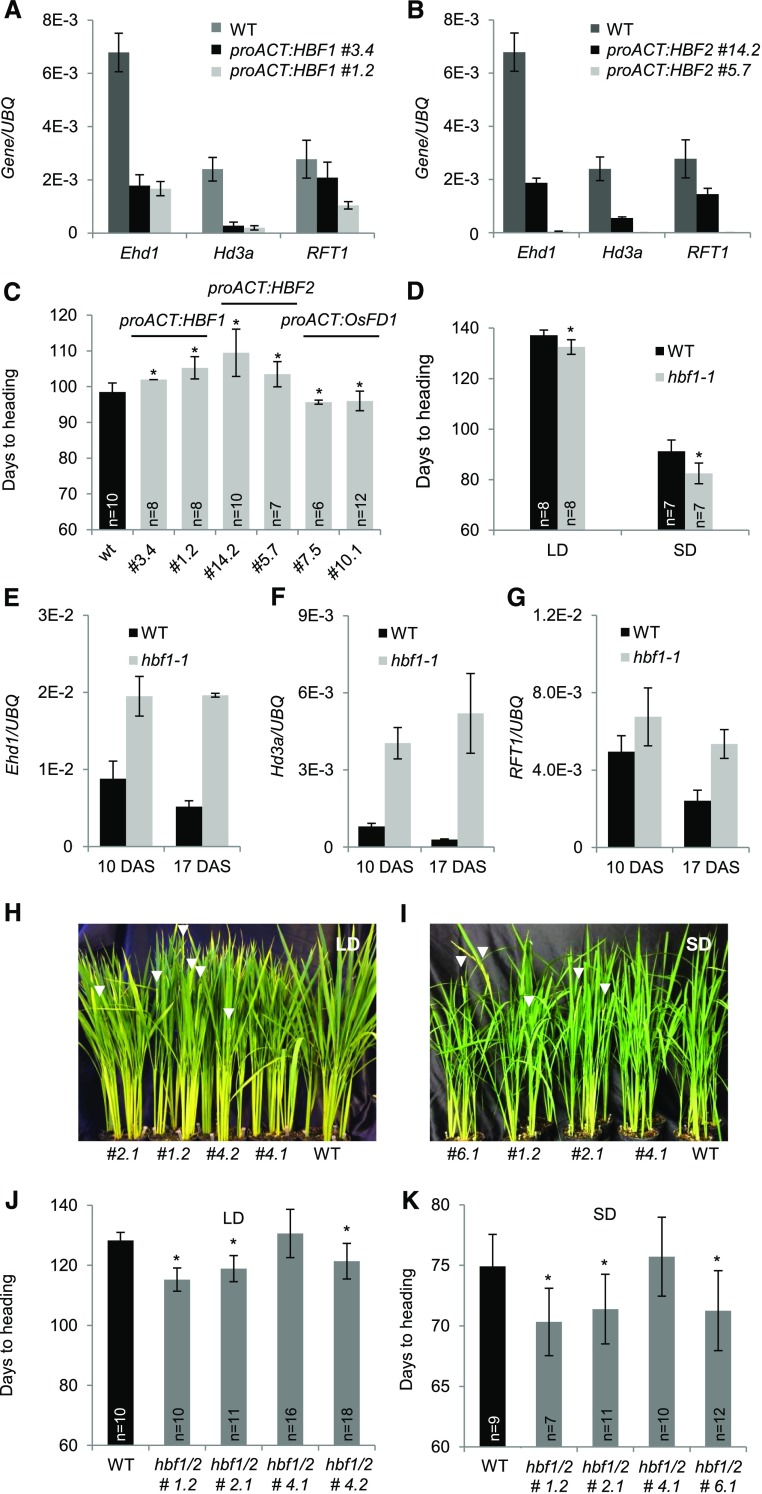
Figure 5.
HBF1 and HBF2 Encode Floral Repressors Reducing Ehd1 Expression.
(A) and (B) Quantification of mRNA levels of Ehd1, Hd3a, and RFT1 in leaves of proACT:HBF1 (A) and proACT:HBF2 (B) overexpression plants grown for 8 weeks under LD (16 h light) and then shifted to SD (10 h light). UBQ was used as standard for quantification of gene expression. Data are represented by mean ± sd.
(C) Days to heading of wild type, proACT:HBF1, proACT:HBF2, and proACT:OsFD1 overexpressors grown for 8 weeks under LD (16 h light) and then shifted to SD (10 h light).
(D) Heading dates of wild type (Dongjin) and hbf1-1 mutants grown under continuous LD (14.5 h light) or continuous SD (10 h light).
(E) to (G) Expression of Ehd1 (E), Hd3a (F), and RFT1 (G) in hbf1-1 mutant plants compared with the wild type.
(H) to (K) mRNA levels are shown at 10 and 17 d after shifting plants from LD to SD.
(H) and (I) Nipponbare wild type and T2 hbf1 hbf2 CRISPR mutants grown under continuous LD (14.5 h light) (H) or shifted from LD (16 h light) to SD (10 h light) 8 weeks after sowing (I). Arrowheads indicate the emerging panicles.
(J) and (K) Quantification of heading dates in the same plants as in (H) and (I), respectively (n indicates the number of plants scored). Asterisks indicate P < 0.05 in an unpaired two tailed Student’s t test. E-n = × 10−n. The detailed genotypes of the mutants are reported in Supplemental Figure 5C.
ANOVA tests for graphs in (A) to (G), (J), and (K) are shown in Supplemental File 1.

