Figure 1.
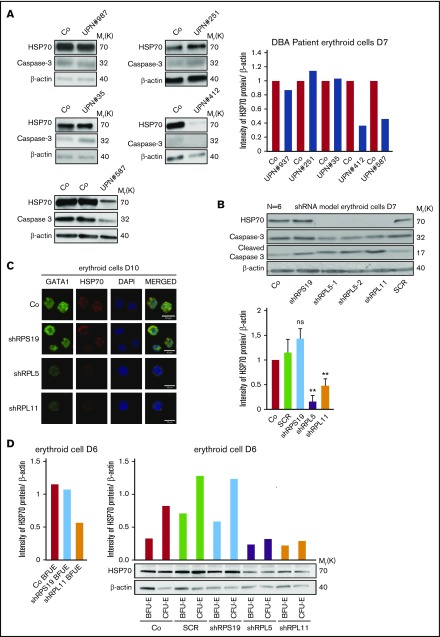
HSP70 expression level in human erythroid cell culture from DBA patients’ peripheral blood CD34+cells and from cord blood CD34+depleted in RPS19, RPL5, or RPL11 after shRNA infection. (A) Immunoblots of HSP70 and procaspase-3 at day 10 of erythroid cell culture (20 000 cells) from CD34+ peripheral blood from DBA-affected patients carrying various RP gene mutations: RPL5Mut/+ (UPN#412), RPL11Mut/+ (UPN#587), and RPS19Mut/+ (UPN#987, UPN#251, UPN#35) DBA-affected patients compared with the healthy controls (Co). HSP70 and procaspase-3 expression levels have been compared with β-actin expression. Molecular weight (Mr). (B) Immunoblots of HSP70 and procaspase-3 at day 7 of erythroid cell culture (50 000 cells) from cord blood CD34+ infected with various shRNAs against RPS19 (shRPS19), RPL5 (shRPL5-1 and shRPL5-2), and RPL11 (shRPL11) compared with noninfected CD34+ (Co) and Scramble (SCR). Representative of 5 independent experiments. Quantification of HSP70 protein immunoblot band intensity by ImageJ software (National Institutes of Health [NIH]) compared with β-actin from the 5 independent experiments is represented lower. (C) Study of HSP70 and GATA1 expression by immunostaining and analyzed by confocal microscopy at day 10 of erythroid cell culture from cord blood CD34+ infected with various shRNAs against RPS19 (shRPS19), RPL5 (shRPL5), and RPL11 (shRPL11) compared with noninfected CD34+ (Co). Shown are HSP70, GATA1, DAPI, and merged HSP70 and GATA1 stainings. Original magnification ×60. Scale bar represents 10 μm. (D) Study of HSP70 expression normalized to β-actin at day 6 of synchronized BFU-E and CFU-E progenitors obtained from cord blood CD34+ infected with various shRNAs against RPS19 (shRPS19), RPL5 (shRPL5), and RPL11 (shRPL11) compared with noninfected CD34+ (Co) and Scramble (SCR). Left: HSP70 expression after quantification of each immunoblot band by ImageJ software (NIH) compared with β-actin, in control BFU-E compared with shRPS19 and shRPL11 BFU-E (1 experiment-immunoblot in supplemental Figure 2E). Right top: HSP70 expression level after quantification of each immunoblot band by ImageJ software (NIH) compared with β-actin obtained in synchronized BFU-E and CFU-E. Right bottom: Immunoblot of HSP70 expression level in the synchronized BFU-E and CFU-E erythroid progenitors in each condition (20 000 cells/lane).

