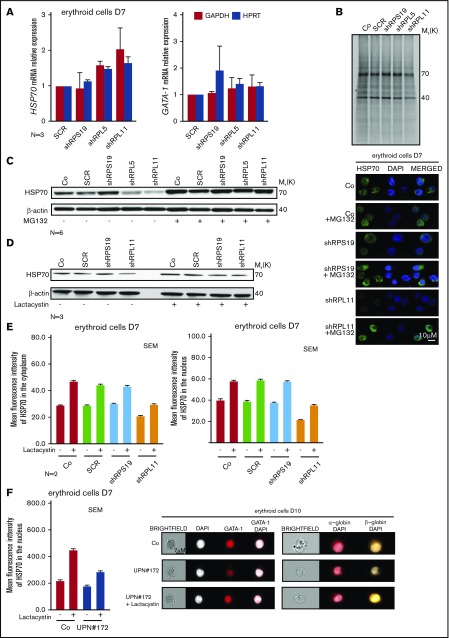
Figure 5.
HSP70 decreased expression level is because of a proteasomal degradation. (A) HSP70 and GATA1 gene expression analysis by qRT-PCR in CD34+ human cells, transduced with shRPS19, shRPL5, or shRPL11 relative to the Scramble (SCR) transduced cells and compared with nontransduced cells (Co) at day 7 of erythroid differentiation. The data are shown as the mean ± the standard deviation (for 3 independent samples) and normalized to GAPDH and HPRT reporter genes. (B) Immunoprecipitation of HSP70 protein after S35* metabolic staining of EPO-dependent UT-7 cell line depleted in RPS19 (shRPS19), in RPL5 (shRPL5), or in RPL11 (shRPL11) compared with SCR transduced erythroid cells or nontransduced cells (Co). HSP70 is normally expressed at 70 kDa in each condition. Western blot of HSP70 protein is shown in depleted RPS19 (shRPS19), or RPL11 (shRPL11) erythroid cells compared with controls (Co and SCR), at day 7 after proteasome inhibitor treatment. The cells have been treated with or without MG132 at 10 µM for 1 hour (C) or with or without lactacystin at 50 µM for 2 hours (D). (E) Left panels: Analysis of HSP70 protein expression level in the 2 subcellular compartments (cytoplasm, left panel and nucleus, right panel) of erythroid cells at day 7 of terminal erythroid differentiation in depleted RPS19 (shRPS19), and RPL11 (shRPL11) erythroid cells compared with controls (Co, SCR). The erythroid cells have been treated with or without lactacystin at 50 µM for 2 hours. The results obtained by using imaging flow cytometry (ImageStream) are presented as the MFI ± the standard deviation representative of 3 independent experiments. Right panel: HSP70 protein expression and localization analysis by confocal microscopy in erythroid cells transduced with shRPS19 or shRPL11 compared with nontransduced cells (Co) at day 7 of erythroid culture. The erythroid cells have been treated with or without MG132 at 10 µM for 1 hour. Shown are HSP70, DAPI, and merged HSP70 and DAPI stainings. Original magnification ×60. Scale bar represents 10 µm. (F) HSP70 protein expression into the nucleus of erythroid cells at day 7 of erythroid culture from a DBA-affected patient (UPN#172), carrying a mutation in RPL11 gene (left panel). The erythroid cells have been treated with or without lactacystin at 50 µM for 2 hours. The results obtained by using imaging flow cytometry (ImageStream) are presented as the MFI ± the standard deviation. Representative images obtained using imaging flow cytometry (ImageStream) of GATA1 (middle panel), α-globin and β-globin (right panel) in erythroid cells at day 10 of culture from the RPL11+/Mut mutated DBA-affected patient (UPN#172) compared with a healthy control (Co). The erythroid cells from the DBA patient have been treated with or without lactacystin at 50 µM for 2 hours. Shown standard bright-field images, DAPI, GATA1 and merged GATA1/DAPI, α-globin/DAPI, and β-globin/DAPI stainings. Original magnification ×60. Scale bar represents 7 µm.

