
Figure 3. Subgroup analysis of adherence to prescriptions of prophylactic BPG injections.
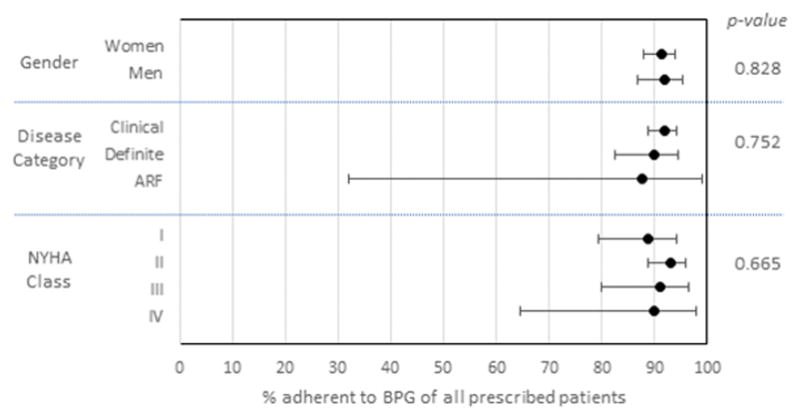
Point estimates represent the percentage of participants who were prescribed BPG who were optimally adherent (>80% of prescribed injections). Error bars reflect 95% confidence intervals. Chi-squared p-value is shown on the right.