
Figure 5. Heat map of optimal BPG adherence by district.
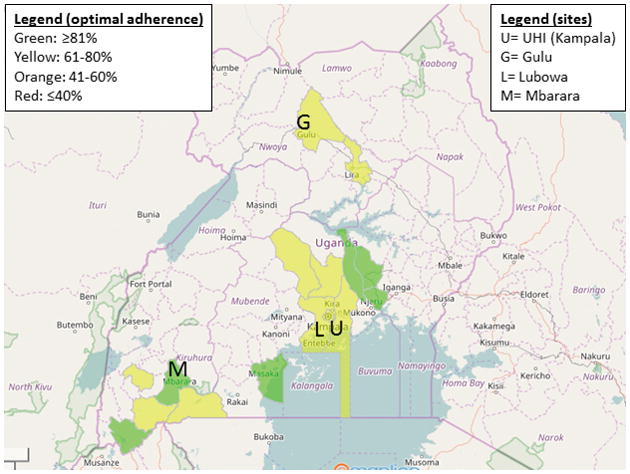
Color coding represents the proportion of patients optimally adherent (>80% of prescribed doses received). Only districts reporting at least five patients prescribed BPG were included in this analysis. The locations of the clinic sites are shown with letters.