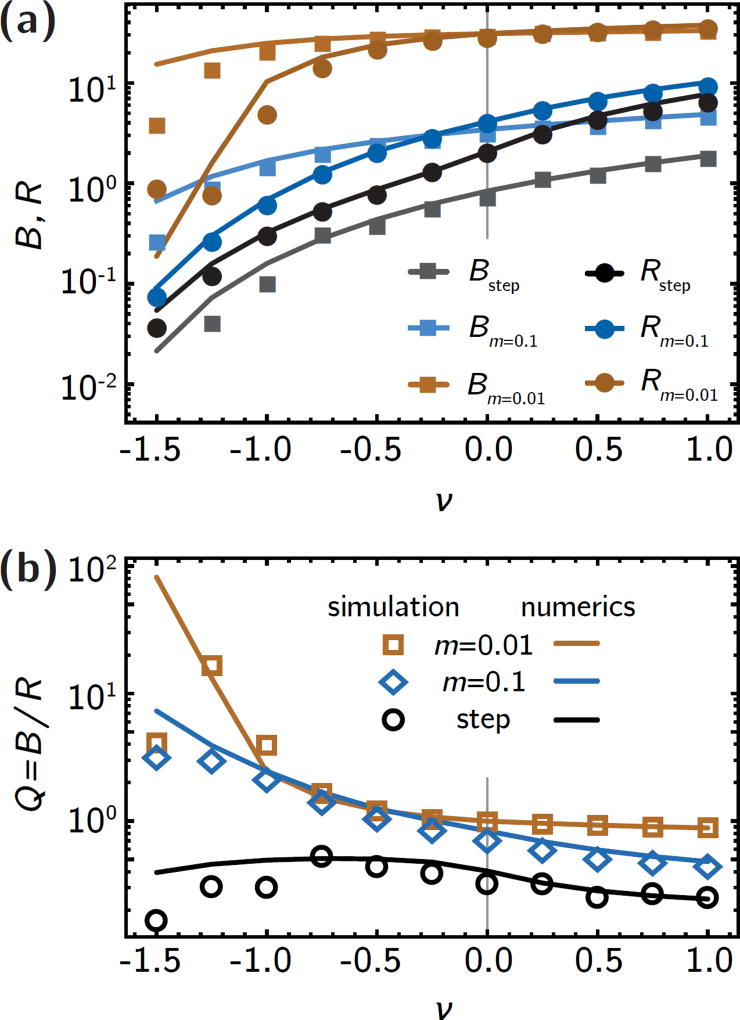
Figure 7.
Comparison between simulations and numerical solutions. (a) Total death rate B and rate of adaptation, R, computed from simulations (symbols) and numerical solutions to eqs. 5 and 7 (lines), in three different gradients (as in Fig. 3). The agreement is very good, except for strong counter-flow, where number fluctuations at the front become important, as explained in the main text. (b) The treatment efficiency Q found in simulations is also well-captured by our model, except for strong counter-flow.

