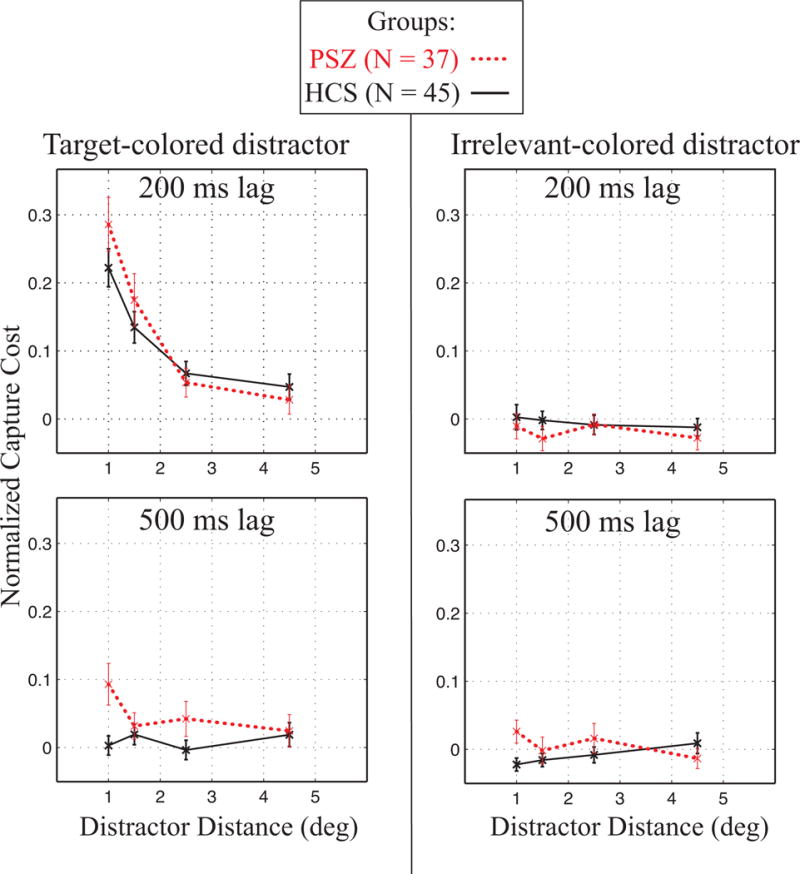
Figure 2.

Normalized capture cost as a function of distractor distance. Left column shows data from the target-colored distractor trials and right column form the irrelevant-colored distractor trials. The top row shows data from the 200-ms lag trials and the bottom row shows data from the 500-ms lag trials (with lag referring to the SOA between the peripheral distractor and the central target). Error bars show standard error of the mean. PSZ showed an altered pattern of spatial distance, with enhanced distraction to nearby target-colored distractors compared to HCS.
