Figure 4.

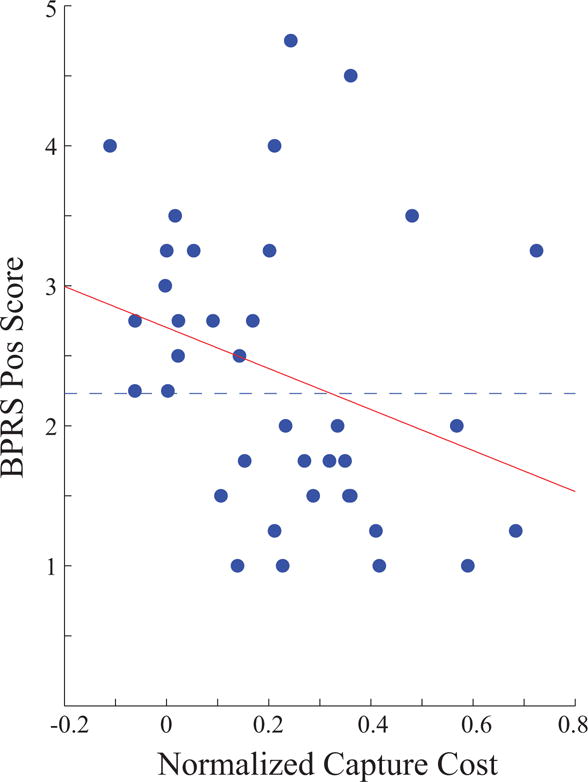
Scatter plot of BPRS-Pos scores and normalized capture cost for near target-colored distractors presented at 200-ms lag. Dotted line shows group division for median split analysis shown in Figure 3.

Scatter plot of BPRS-Pos scores and normalized capture cost for near target-colored distractors presented at 200-ms lag. Dotted line shows group division for median split analysis shown in Figure 3.