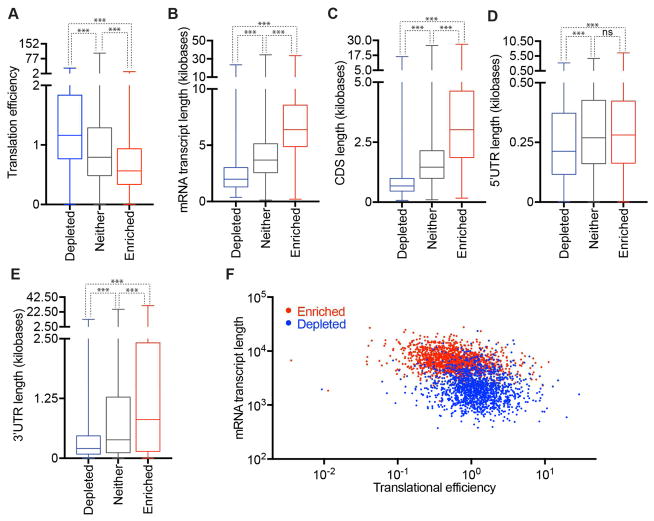
Figure 4. Physical basis of differential mRNA recruitment to mammalian SGs.
(A–E) Boxplots depicting (A) translational efficiency, (B) total transcript length, (C) CDS length, (D) 5’ UTR length, and (E) 3’UTR length for each of the three classes of mRNA localization during stress: SG enriched mRNAs, SG depleted mRNAs, or neither. (F) Scatter plot depicting the mRNA transcript length vs. translational efficiency for SG enriched (red) and SG depleted (blue) mRNAs. n.s. (not significant) = p > .05 and *** = p value ≤0.001 (Student’s t-test).

