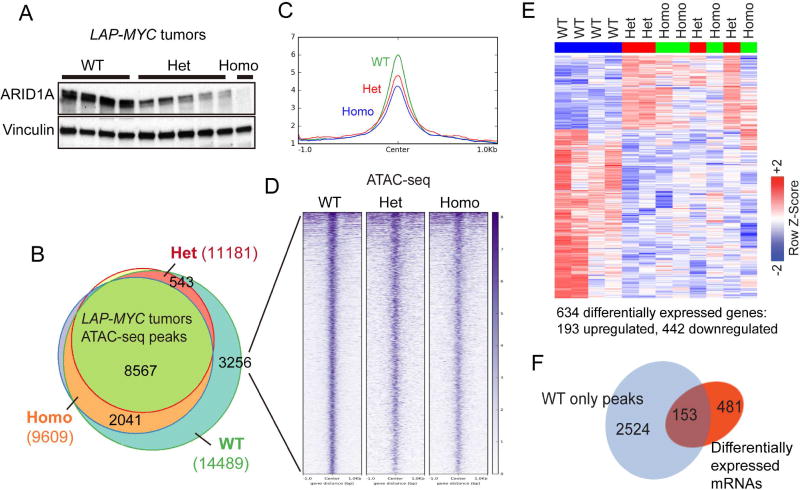
Figure 6. Partial and complete Arid1a loss increased chromatin occupancy and altered gene expression to similar extents.
(A) ARID1A protein expression in LAP-MYC tumors.
(B) ATAC-seq peaks in LAP-MYC; Arid1a WT (n = 4), Het (n = 4), and Homo (n = 3) tumors. Total peaks called are in parentheses.
(C) 3256 ATAC-seq peaks uniquely called in WT tumors are visualized here.
(D) The global view of chromatin accessibility for these 3256 tracks.
(E) RNA-seq of LAP-MYC; Arid1a WT (n = 4), Het (n = 4), and Homo (n = 4) tumors from pure FVB mice. Of 634 differentially expressed genes, 193 were up and 442 were downregulated.
(F) ATAC-seq peaks for 153 genes that are differentially expressed after Arid1a loss. See also Table S3.

